| Regardless of your upsizing strategy, you must roll your own T-SQL equivalents of Jet crosstab queries to provide the data source for upsized charts you created with Microsoft Graph and the Chart Wizard. Your only alternative is to convert all graphs and charts to PivotCharts and recreate their source queries. Jet SQL This is the generalized Jet SQL syntax for crosstab queries: TRANSFORM aggregate_function(field_name) [AS alias] SELECT [ALL|DISTINCT] select_list FROM table_name PIVOT Format(field_name),"format_type") [IN (column_list)] TRANSFORM defines a crosstab query, and PIVOT specifies the GROUP BY characteristics plus the fixed column names specified by the optional IN predicate. |
 To review Jet crosstab query design, see "Creating Crosstab Queries," p. 442 . To review Jet crosstab query design, see "Creating Crosstab Queries," p. 442 .
SQL Server 2000 Books Online calls crosstab queries "cross-tab reports" and equates cross-tab reports with PivotTables. The example creates a trivial result table with explicit numeric values for four quarters of two years. Unfortunately, the topic doesn't show you how to write a stored procedure that emulates the capabilities of Jet's crosstab queries. The frm1997SalesByCategoryChart form you created in Chapter 18, "Adding Graphs, PivotCharts, and PivotTables," has a generic crosstab SQL statement that the Chart Wizard generates from the query you specify as the data source for the chart. The Chart Wizard stores the crosstab SQL statement as the value of the Row Source property of the chart. The Upsizing Wizard upsizes this form, but when you try to open it, you receive an error message that the SQL statement exceeds a maximum length of 128 characters. When you click OK, another error message appears with possible causes of the problem. The fundamental problem repeated several times earlier in this and preceding chapters is that T-SQL doesn't support the Jet SQL TRANSFORM and PIVOT keywords. You must find a way to deliver the data to the chart in the appropriate format. The following sections describe two methods of emulating the result set of crosstab queries in ADP. The Pragmatic Approach for Static Data Cheat If your chart or graph displays historical data that isn't subject to revision, you can save considerable time and effort by creating an SQL Server table from the output of the crosstab query the Chart Wizard generates. Tip Check with your organization's chief financial or executive officer before committing to a static version of historical financial data. Retroactive revision of prior financial data sometimes involving several years of data became increasingly common in 2001 and later.
Creating a Worksheet from the Crosstab Query Result Set Cheating by creating a static table isn't as straightforward as you might expect. You use an Excel worksheet as an intermediary in the process. To create the initial worksheet, do the following:  Open the original Jet version of the form with a graph or chart created by the Chart Wizard. This example uses the frm1997SalesByCategoryChart form you created in Chapter 18. A copy of this form is included in Upsize22.mdb; this example uses the copy. Open the original Jet version of the form with a graph or chart created by the Chart Wizard. This example uses the frm1997SalesByCategoryChart form you created in Chapter 18. A copy of this form is included in Upsize22.mdb; this example uses the copy.
  Change to Design view, right-click the unbound object frame, usually OLEUnbound0, and choose Properties to open the object's Properties window. Change to Design view, right-click the unbound object frame, usually OLEUnbound0, and choose Properties to open the object's Properties window.
 Click the Data tab, select the entire SQL statement in the text box of the Row Source property, and copy the statement to the Clipboard. Click the Data tab, select the entire SQL statement in the text box of the Row Source property, and copy the statement to the Clipboard.
  Open a new query in Design view, close the Show Table dialog, and click the SQL view button. Open a new query in Design view, close the Show Table dialog, and click the SQL view button.
Jet SQL Following is the Jet SQL statement for the Record Source of frm1997SalesByCategoryChart's OLEUnbound0 unbound object frame: TRANSFORM Sum([Amount]) AS [SumOfAmount] SELECT (Format([ShippedDate],"MMM 'YY")) FROM [qry1997SalesChart] GROUP BY (Year([ShippedDate])*12 + Month([ShippedDate])-1), (Format([ShippedDate],"MMM 'YY")) PIVOT [CategoryName]; The crosstab query uses the qry1997SalesChart query, which upsizes successfully. |
To review the process for creating the graph, see "Generating Graphs and Charts with Microsoft Graph," p. 704 .
  Paste the SQL statement into the SQL window, and click Run to verify the data returned. Figure 22.20 shows the query result set from the example chart. Paste the SQL statement into the SQL window, and click Run to verify the data returned. Figure 22.20 shows the query result set from the example chart.
Figure 22.20. Datasheet view of the chart's crosstab query shows the tabular data structure required to populate the chart's datasheet. 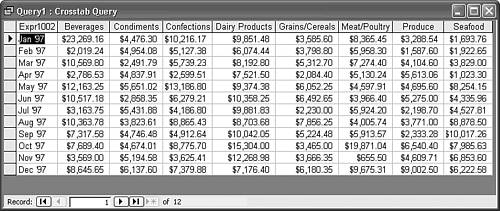 Tip Changing the crosstab query type to a make-table query doesn't create a table with the crosstab structure. However, you can use the crosstab query as the data source for a make-table query. Another approach is to save the crosstab query and export its result set to a worksheet, but copying the cells to a worksheet is faster, especially if you have many upsized charts to fix. Press Ctrl+A to select all records in the datasheet, and press Ctrl+C to copy the cell values to the Clipboard. Launch Excel 97 or later with a new workbook. With the cursor in cell A1, press Ctrl+V to paste the cells to Sheet1. Tip If you want to use the crosstab table as a record source for other queries in the project, select the columns with numerical data, and format the cells as Number or Currency. Rename Sheet1 to identify the table (tbl1997SalesByCategoryChart for this example), and save the workbook with a descriptive name, such as JetCrosstabs.xls (see Figure 22.21). Figure 22.21. This Excel 2003 worksheet serves as the data source for a new SQL Server table you can use as the Row Source for the upsized frm1997SalesByCatego ryChart form.  Repeat steps 1 8 for each form or report that contains a Wizard-created chart. In step 7, use the saved workbook and add a new worksheet to store the additional query result set copies. Close the workbook. You can't import the worksheet data if the workbook is open.
 | The JetCrosstabs.xls workbook is included in the \Seua10\Chaptr22 folder of the accompanying CD-ROM. The three worksheets have cells formatted as Text, Number, and Currency. |
Importing the Worksheet to an SQL Server Table Do the following to import the workbook data to SQL Server for your project and enable forms and reports that include charts:  Open the project that contains the upsized form with the inoperable chart, UpsizeCS.adp for this example. Open the project that contains the upsized form with the inoperable chart, UpsizeCS.adp for this example.
Choose File, Get External Data, Import, to open the Import dialog, and choose Microsoft Excel (.xls) in the Files of Type list. Navigate to the location of the workbook you saved, and double-click the file to start the Import Spreadsheet Wizard. In the first Wizard dialog, select the worksheet for the SQL Server table to create, and click Next. In the second dialog, mark the First Row Contains Column Headings check box, and click Next. In the third dialog, accept the In a New Table option (see Figure 22.22), and click Next. Figure 22.22. Importing the crosstab worksheet with the Import Spreadsheet Process is quick, because you accept all default values. You can speed the process by clicking Finish after selecting the worksheet in the first Wizard dialog.  If you renamed the worksheet to correspond to the SQL Server table name in step 8 of the preceding section, accept the worksheet name as the table name, and click Finish to create the table in the current SQL Server database (UpsizeSQL for this example). Click OK to clear the confirmation message and then open the new SQL Server table to verify the import process, and check the data types in Design view. Right-click the chart and choose Properties to open the Properties window for the unbound object frame. (The presentation of the graph in Design view is static.) Click the Data tab, open the Row Source list, and select the imported table corresponding to the crosstab query to replace (see Figure 22.23). Figure 22.23. Specify the new SQL Server table you created as the value of the Row Source property of the chart.  Close the Properties window, and change to Form or Report view to test the data source. Figure 22.24 shows the upsized frm1997SalesByCategoryChart form. Figure 22.24. The upsized 1997 Monthly Sales by Category form is identical to its Jet counterpart. 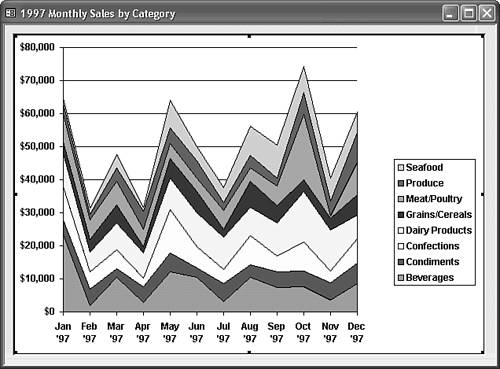 Repeat steps 2 10 for each worksheet in your crosstab workbook.
Modifying the Table to Accommodate a Linked Chart Linked charts require that the crosstab table column names for the Link Master Fields and Link Child Fields correspond. Forms having linked charts usually specify the name of a table or query as the Record Source for the form and a crosstab query as the Row Source for the chart. To review linking graphs, see "Creating a Linked Graph from a Jet Crosstab Query," p. 720 .
Using the upsized frm1997SalesByCategoryChartLinked form you created in Chapter 18 as an example, follow these steps to fix linked MSGraph objects: Open the form in Design view, right-click the graph, open the Properties window, and click the Data tab. Verify that the table(s) that provide the Record Source property of the form and the Row Source property of the chart have the fields specified by the Link Master Fields and Link Child Fields properties.  The linking field of tbl1997SalesByCategoryChart table is Expr1002 (refer to Figure 22.21), so open the table in Design view and change the name of the first field to Categories. (Nonlinked graphs don't use the field name of the first column.) The linking field of tbl1997SalesByCategoryChart table is Expr1002 (refer to Figure 22.21), so open the table in Design view and change the name of the first field to Categories. (Nonlinked graphs don't use the field name of the first column.)
Specify the table as the Row Source for the chart. If the form uses a crosstab query as its Record Source, change the Record Source property value to the name of the crosstab table, tbl1997SalesByCategoryChart in this case. Verify that the linked form behaves and appears identically to the original Jet version, and save your changes.
The Better Approach for Dynamic and Static Data Stored Procedures Creating crosstab tables from the contents of datasheets isn't a generally accepted programming practice, so this section describes how to emulate the Jet SQL crosstab statement for the Record Source of frm1997SalesByCategoryChart's OLEUnbound0 unbound object frame. The primary advantage of a table-creating stored procedure is that the table is based on live not static data. A secondary benefit is that a single parameterized stored procedure can handle multiple time periods, such as years, that you specify by the parameter value. There are two basic steps to the stored procedure approach: Design a view that returns the values you need for the table For this example, the values are 8 category names, 12 month names in MMM 'YY format, and total sales amounts for each category by month. The upsized qry1997SalesChart view is the starting point for the final view design. The view takes advantage of T-SQL's DATENAME and DATEPART functions to create the formatted month names and sort them in calendar order. Write a stored procedure that creates the crosstab table from the view's output This is the step that involves the most effort. You use a series of CREATE TABLE, INSERT [INTO], and multiple UPDATE statements to create and populate the table. A SELECT * FROM tablename statement at the end of the stored procedure code delivers the table's data to the chart.
Tip Substitute ActiveX PivotCharts for MSGraph OLE charts in your new Jet applications. Relatively simple views, functions, or stored procedures serve as the data source for PivotCharts and their underlying PivotTables in ADP. The Chart Wizard isn't available within ADP because it depends on Jet crosstab queries.
Modifying the Upsized qry1997SalesChart View The upsized qry1997SalesChart view returns one record with the total sale amount of products in a category for each date on which a product shipped in 1997. The total number of records returned by the query is about 1,042. You must group the records to return totals for each category by month. You also must change the format of the grouped field to correspond with that generated by the Chart Wizard. Following are the steps to modify UpsizeCS.adp's qry1997SalesChart view:  Open the view in Design view, and click the SQL button to open the SQL pane. Adjust the position of the field lists and the depth of the panes. Open the view in Design view, and click the SQL button to open the SQL pane. Adjust the position of the field lists and the depth of the panes.  Click the Group By button, change the Group By criterion of the aliased Amount column to Sum, and the ShippedDate column to Where. Making this change adds another ShippedDate entry to the columns list (see Figure 22.25). Click the Group By button, change the Group By criterion of the aliased Amount column to Sum, and the ShippedDate column to Where. Making this change adds another ShippedDate entry to the columns list (see Figure 22.25).
Figure 22.25. The upsized qry1997SalesChart adds the dbo. prefix to all table and column names, and translates the VBA CCur function to CONVERT(money,ColumnValue). Initial grouping is based on the values or the CategoryName and ShippedDate columns. 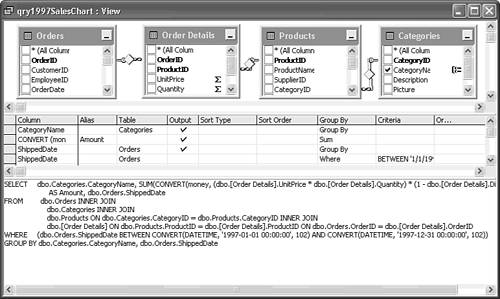 Grouping by month, not by individual shipping date is required and you need the MMM 'YY format. Modify the ShippedDate column with the Group By setting as follows: LEFT(DATENAME(month, dbo.Orders.ShippedDate), 3) + ' ''' + SUBSTRING(DATENAME(year, dbo.Orders.ShippedDate), 3, 2) T-SQL DATENAME(month, DateTimeField) returns the full name of the month. The LEFT function returns the three-letter month abbreviation. T-SQL uses the + symbol for string concatenation. The ' ''' expression adds a space and apostrophe after the month abbreviation. (An escape sequence of two apostrophes displays '.) The SUBSTRING(Expression, 3, 2) function returns the last two digits of the year (97 for this example). |
Replace the added Expr1 alias with Month in the Alias column. A numeric month value is required to sort the output of the view by Category and calendar (not alphabetic) month. Add the following new column definition: DATEPART(month, dbo.Orders.ShippedDate) T-SQL DATEPART([month|quarter|year], DateTimeField) returns the numeric value of the time period. |
Replace the added Expr1 alias with MonthNum in the Alias column. Specify an Ascending sort on the CategoryName column and another Ascending sort on the MonthNum column. Adding the GROUP BY clauses automatically adds TOP 100 PERCENT to the SELECT statement. Your view design appears as shown in Figure 22.26. Figure 22.26. The final design of the qry1997SalesChart view illustrates the complexity of T-SQL statements with fully qualified table and field identifiers. 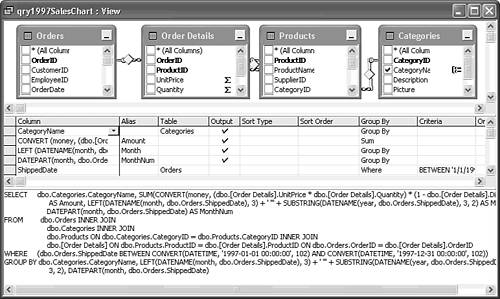  Click Check SQL Syntax to verify your changes, and run the view saving your changes to display its output (see Figure 22.27). Click Check SQL Syntax to verify your changes, and run the view saving your changes to display its output (see Figure 22.27).
Figure 22.27. The output of the modified qry1997SalesChart view provides the required 96 rows of source data for the stored procedure. 
Jet SQL Following is the full T-SQL statement for the modified view: SELECT TOP 100 PERCENT dbo.Categories.CategoryName, SUM(CONVERT(money, (dbo.[Order Details].UnitPrice * dbo.[Order Details].Quantity) * (1 - dbo.[Order Details].Discount))) AS Amount, LEFT(DATENAME(month, dbo.Orders.ShippedDate), 3) + ' ''' + SUBSTRING(DATENAME(year, dbo.Orders.ShippedDate), 3, 2) AS Month, DATEPART(month, dbo.Orders.ShippedDate) AS MonthNum FROM dbo.Orders INNER JOIN dbo.Categories INNER JOIN dbo.Products ON dbo.Categories.CategoryID = dbo.Products.CategoryID INNER JOIN dbo.[Order Details] ON dbo.Products.ProductID = dbo.[Order Details].ProductID ON dbo.Orders.OrderID = dbo.[Order Details].OrderID WHERE (dbo.Orders.ShippedDate BETWEEN CONVERT(DATETIME, '1997-01-01 00:00:00', 102) AND CONVERT(DATETIME, '1997-12-31 00:00:00', 102)) GROUP BY dbo.Categories.CategoryName, LEFT(DATENAME(month, dbo.Orders.ShippedDate), 3) + ' ''' + SUBSTRING(DATENAME(year, dbo.Orders.ShippedDate), 3, 2), DATEPART(month, dbo.Orders.ShippedDate) ORDER BY dbo.Categories.CategoryName, DATEPART(month, dbo.Orders.ShippedDate) The CONVERT(DATETIME, '1997-01-01 00:00:00', 102) expression changes the standard SQL Server date format to the ANSI yyyy.mm.dd standard without the time data. Specifying 101 as the second argument value returns the U.S. m/d/yyyy format. |
Writing the spCategoriesCT Stored Procedure Creating the crosstab table from the modified qry1997SalesChart view with a stored procedure isn't a piece of cake. After you understand the basic principles involved, however, it's easy to clone the sample design to accommodate a variety of crosstab scenarios. You also learn how to write INSERT INTO and UPDATE statements to create nontraditional table structures that don't conform to the rules of relational databases. The table you create in this section is akin to a spreadsheet and isn't a legitimate base table because it has repeating category columns. The stored procedure to create the crosstab table must accomplish the following tasks: Create a table structure with field names and data types that correspond to those of the Jet query result set. For this example, the first field contains row headers (month names and years). The remaining field names represent column headers (categories) and contain total sales amounts. Note Recreating a new table requires that you drop (delete) the existing table; otherwise you receive a "table exists" error message. The first instruction in your stored procedure must test for the presence of the table.
Append a row to the table for each row header with an INSERT INTO table_name (field_name(s)) SELECT DISTINCT field_name(s) FROM view_name statement. Update amount values for each of the column headers with an UPDATE statement that uses a SELECT query to supply the values for all rows. Execute a SELECT * FROM TableName query against the table to deliver the crosstab Recordset to the graph.
The example stored procedure you write in the following steps isn't scalable. Each time someone runs the procedure, it creates a new table. If many users run the procedure simultaneously, locks on the table being deleted and recreated might return errors. You can overcome this problem by using SQL Server's temporary tables, which you specify by adding a # prefix to the table name. The tempdb database holds temporary tables, which SQL Server creates for each user and drops when the user closes her database connection. Using temporary tables, however, complicates the stored procedure code. There's an alternative approach to increase performance in the later "Improving Application Scalability and Performance" section. To create the spCategoriesCT procedure in the UpsizeSQL sample project, do this: In Upsize22.adp, click the Create Stored Procedure in Designer shortcut to open the Stored Procedure1 window. Close the Add Table dialog, and click the SQL button to add the SQL pane. Replace the default SELECT FROMskeleton beginning at the /* line with the following statements: SET NOCOUNT ON IF EXISTS(SELECT table_name FROM information_schema.tables WHERE table_name = 'tbl1997CT') DROP TABLE tbl1997CT T-SQL SET NOCOUNT ON prevents the procedure from returning row (RecordsAffected) counts to the client. The IF EXISTS...DROP TABLE conditional statement removes the table, if it exists in the database. |
 Click the Run button, type spCategoriesCT in the Save As text box, and click OK. Click Yes to close the Query Definitions Differ message and save your SQL statements. The stored procedure designer handles only conventional SELECT queries. Click the Run button, type spCategoriesCT in the Save As text box, and click OK. Click Yes to close the Query Definitions Differ message and save your SQL statements. The stored procedure designer handles only conventional SELECT queries.
Acknowledge the message that the stored procedure executed but returned no records. The project designer window changes to a free-form text editing window, and designer-related buttons disappear from the toolbar. The View button adds an SQL view, which is the same as that for Jet SQL queries. Reformat the initial statement as shown in Figure 22.28. The ALTER PROCEDURE spCategoriesCT AS statement lets you edit and recreate the procedure. Figure 22.28. Adding any T-SQL statement other than a SELECT query in the project designer's SQL pane requires typing the full T-SQL statement in a free-text editing window.  Add the following table definition statement after the DROP TABLE statement to create a table with a structure similar to that of the table described in the earlier "Modifying the Table to Accommodate a Linked Chart" section: CREATE TABLE tbl1997CT (Categories nvarchar(25), Beverages money, Condiments money, Confections money, [Dairy Products] money, [Grains/Cereals] money, [Meat/Poultry] money, Produce money, Seafood money) Click the Run button to create the table and click OK to close the message box. In the Tables page of the Database window, open the tbl1997CT table to check the column headings. The table doesn't have a primary key assigned, so there's no tentative append record and only the field header buttons are present. Return to the spCategoriesCT window, and add the following INSERT statement, which adds 12 records to the table with values for the Categories field: INSERT INTO tbl1997CT (Categories) SELECT DISTINCT Month FROM qry1997SalesChart T-SQL The (Categories) field is required to assign values of the view's Month column to the table's Category field. You don't need to add dbo.tablename. or dbo.viewname. prefixes to the field or column names, because there are no duplicate object names in this example. |
Run the procedure again, and reopen the table in Datasheet view to check the result of the INSERT operation. Tip A SELECT * FROM tbl1997CT after the last statement you add to the procedure automatically opens the Datasheet view of the table when you run the procedure. Add the following statement to replace NULL values in the Beverages field with corresponding values from the source query: UPDATE tbl1997CT SET Beverages = Amount FROM qry1997SalesChart WHERE CategoryName = 'Beverages' AND Categories = Month Note The join you create between the table and view with the Categories = Month expression of the WHERE clause is important. If you don't join the table and view, Amount values in records 2 12 add to the table in random order. (The first record is correct for all fields.) This is unexpected behavior, because the view is ordered such that records should update in calendar order. Test the result of the added UPDATE statement (see Figure 22.29) and then add seven more UPDATE statements for the remaining product categories. Replace Beverages with the category name for each column. Surround field names having spaces or virgules (/) with square brackets except when in WHERE clause references (see Figure 22.30). Figure 22.29. The INSERT statements of steps 9 and 11 add values for the first two columns to the table.  Figure 22.30. The last step in writing the stored procedure is to write seven more UPDATE statements to add values to the Condiments...Seafood fields.  Tip | To save typing the additional seven INSERT statements, see the note at the end of the next section. |
If you didn't add SELECT * FROM tbl1997CT earlier, do it now, and click Run to display the final result of your stored procedure (see Figure 22.31). Figure 22.31. The table created by the spCategoriesCT procedure is almost identical to that created by copying the Jet crosstab query result set shown in Figure 22.20. The only difference is the name of the first field, which has been changed to Categories to support the sample linked chart. 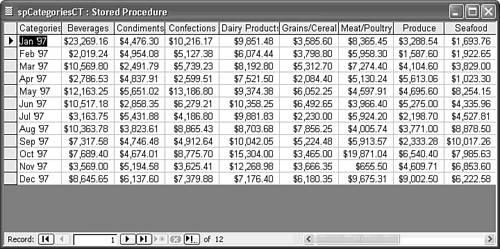
 | If the datasheet doesn't open when you run the procedure, see the "Stored Procedures Don't Return the Expected Recordset" topic of the "Troubleshooting" section near the end of the chapter. |
To test the stored procedure with the frm1997SalesByCategoryChart form in UpsizeCS.adp, change the Row Source property of the chart from tbl1997SalesByCategoryChart to spCategoriesCT. The graph duplicates that with the copied table as its Row Source. With a linked graph, you can use the stored procedure as the Record Source property of the form, but not as the Row Source property of the graph. If you change both record sources to the stored procedure, the link between the master and child fields fails, and the graph displays a line for every category. To solve this problem, change the Record Source property value of the form to spCategoriesCT and the Row Source property value of the chart to tbl1997CT. Opening the form executes the stored procedure to update the table. Using the table as the Row Source for the chart also improves performance, because the procedure doesn't execute each time you change the category. Improving Application Scalability and Performance Opening the frm1997SalesByCategory chart with a stored procedure as the chart's data source is noticeably slower than with a table. On the 667MHz Pentium III machine with 256MB RAM running Windows 2000 Server used to create the examples of this chapter, the difference is about a second. If your SQL Server machine is slower, has less RAM, or serves many simultaneous users, executing the stored procedure can incur a greater performance hit. You can solve the scalability issues raised in the preceding section and improve the performance of forms based on table-creating stored procedures by recreating the table only when required by changes to the table's source data. For example, updating sales data once per day might be sufficient. In this case, you need to compare the last creation date and time with the current system date, and skip the table-creation process if the difference is, say, less than 12 hours. SQL Server's DATEDIFF function can compute the difference in hours between the time the table was last created and the system time returned by the GETDATE function. To prevent creating a new table when the existing table is less than 12 hours old, do this: In SQL view of the spCatetoriesCT procedure, add the following lines after SET NOCOUNT ON: IF EXISTS(SELECT table_name FROM information_schema.tables WHERE table_name = 'tbl1997CT') BEGIN DECLARE @tabletime datetime SET @tabletime = (SELECT crdate FROM sysobjects WHERE name = 'tbl1997CT') IF DATEDIFF(hh, @tabletime, GETDATE()) < 12 GOTO shortcut END Add the following label above the SELECT * FROM tbl1997CT statement: shortcut: Run the procedure to save your changes and click Run again to test the speed of opening the datasheet from the stored procedure.
T-SQL Following is a brief explanation of the new T-SQL statements in the preceding example: BEGIN...END defines a block of code that executes if the IF condition is satisfied. DECLARE @tabletime datetime declares a local variable of the datetime data type. SET @tabletime = (SELECT...) sets the value of the variable to the crdate (creation date and time) of the existing table. The sysobjects table holds the properties of all objects in the current database. DATEDIFF(hh, @tabletime, GETDATE()) returns the difference in hours between the current system time and the existing table. GOTO shortcut causes execution to jump to the shortcut: label, which returns the result set from the existing table to the graph. |
The two preceding sections demonstrate the power and flexibility of SQL Server stored procedures. After you become familiar with T-SQL's additional reserved words for use in stored procedures, writing more complex stored procedures to enforce business rules and perform sophisticated data-validation operations is the next step. Many developers use middle-tier Component Object Model (COM) components between the client and server (called three-tier architecture) to validate data and enforce business rules. Well-written stored procedures, however, are much simpler to create and maintain and often provide better performance than middle-tier COM components. Note | Text files containing the T-SQL code for the modified qry1997SalesChart view (vwChart.txt) and the spCategoriesCT stored procedure (spChart.txt) are included in the \Seua11\Chaptr22 folder of the accompanying CD-ROM. If you didn't perform the preceding exercises, open the file in Notepad, copy the text to the Clipboard, and paste the statement to the SQL pane of a new view or stored procedure. |
|