| Reports, like forms, can include subreports. Unlike the Form Wizard, however, the Report Wizard offers no option for automatically creating reports that include subreports. You can add subreports to reports that you create with the Report Wizard, or you can create subreports from blank reports, like you did in the earlier section, "Working from a Blank Report." Adding a Linked Subreport to a Bound Report If a main report is bound to a table or query as a data source and the subreport's data source can be related to the main report's data source, you can link the subreport's data to the main report's data. To add and link the rpt1997MonthlyCategoryOrders report as a subreport to the Inventory by Category report, for example, follow these steps:  Open the original version of the rptInventoryByCategory report from Chapter 16 in Design view. Open the original version of the rptInventoryByCategory report from Chapter 16 in Design view.
Drag down the top of the Page Footer border to make room for the subreport in the CategoryID Footer section (about 0.5 inch).  Click the toolbar's Database Window button. If the Database window is maximized, click the Restore button. Click the toolbar's Database Window button. If the Database window is maximized, click the Restore button.
Click and drag the small Report icon from the left of the rpt1997MonthlyCategoryOrders report to a location inside the CategoryID Footer section. The caret becomes an arrow with a plus (+) sign inside a square. Position the tip of the arrow one dot to the right of the left margin and one dot below the bottom of the CategoryID text box. When you release the right mouse button, Access adds a subreport control, which displays the subreport in Design view within a frame for in-site editing. Delete the subreport's label (see Figure 17.16). Figure 17.16. Drag a report's icon to a section of another report and drop it to automatically add the subreport.  Adjust the CategoryID Footer's depth to provide about 0.1-inch margins above and below the section's controls.  You need to link the data in the subreport to the data of the main report so that only the sales data corresponding to a specific group's CategoryID value appears in the CategoryID footer section. Select the subreport control's frame not the subreport inside the frame and click the Properties button to display the subreport's Properties window. Click the Data tab, and click the Builder button of the Link Child Fields property's text box or the Link Master Fields text box to open the Subreport Field Linker dialog (see Figure 17.17). You need to link the data in the subreport to the data of the main report so that only the sales data corresponding to a specific group's CategoryID value appears in the CategoryID footer section. Select the subreport control's frame not the subreport inside the frame and click the Properties button to display the subreport's Properties window. Click the Data tab, and click the Builder button of the Link Child Fields property's text box or the Link Master Fields text box to open the Subreport Field Linker dialog (see Figure 17.17).
Figure 17.17. Be sure to select the frame, which displays the sizing handles, when you click the Properties button to create the link. If the sizing handles aren't visible, the Data page doesn't display the two Link... text boxes. 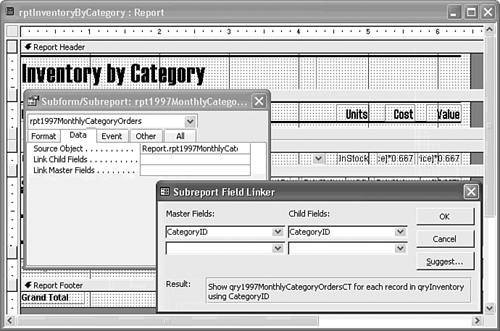 If the link is correct, click OK to close the Subreport Field Linker dialog, and then close the Properties window.  Click the toolbar's Print Preview button to display the report in the full-size view. The subreport appears as shown at the bottom of Figure 17.18. Click the page selector buttons to view other parts of the subreport to confirm that the linkage is correct. Click the toolbar's Print Preview button to display the report in the full-size view. The subreport appears as shown at the bottom of Figure 17.18. Click the page selector buttons to view other parts of the subreport to confirm that the linkage is correct.
Figure 17.18. The appropriate rows of the linked subreport print below the text boxes in the CategoryID Footer section. 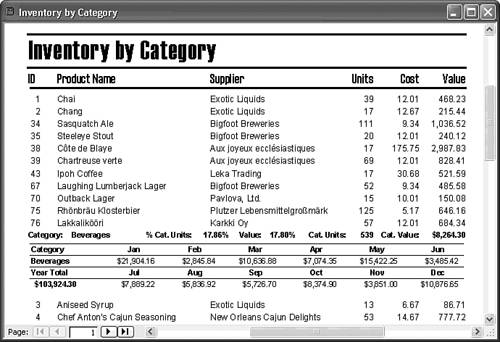 Choose File, Save As, and save the modified report as rptInventoryByCategoryWith1997Sales.
You can add and link several subreports to the main report if each subreport has a field in common with the main report's data source. Tip You can use calculated values to link main reports and subreports. Calculated values often are based on time months, quarters, or years. To link main reports and subreports by calculated values, you must create queries for both the main report and subreport that include the calculated value in a field, such as Month or Year. You create the calculated field in each query by using the corresponding Access date function, Month or Year. To group by quarters, select Interval for the Group On property and set the value of the Group Interval property to 3. You can't use Qtr as the Group On property because the calculated value lacks the Date/Time field data type.
 | If you receive an error message when you try to create a link between the main report and subreport, turn to "Link Expression Errors," in the "Troubleshooting" section at the end of this chapter. |
Using Unlinked Subreports and Unbound Reports Most reports that you create use subreports that are linked to the main report's data source. You can, however, insert independent subreports within main reports. In this case, you don't enter values for the Link Child Fields and Link Master Fields properties. The subreport's data source can be related to or completely independent of the main report's data source. Figure 17.19 illustrates the effect of including an unlinked subreport in a main report. The figure shows a part of page 1 of the rpt1997MonthlyCategoryOrders subreport within the rptInventoryByCategoryWith1997Sales report after deleting the CategoryID values of the Link Child Fields and Link Master Fields properties, prior to saving the report with a new name. Notice that without the link, the subreport displays all records instead of just those records related to the particular category in which the subreport appears. You might need to set the CategoryID Footer section's Keep Together property to No to display the subform on the first page. The Keep Together property is one of the subjects of the "Controlling Page Breaks and Printing Page Headers and Footers" section later in the chapter. Figure 17.19. Removing the link between the master and child fields causes each instance of the CategoryID Footer section to display all rows of the subreport. 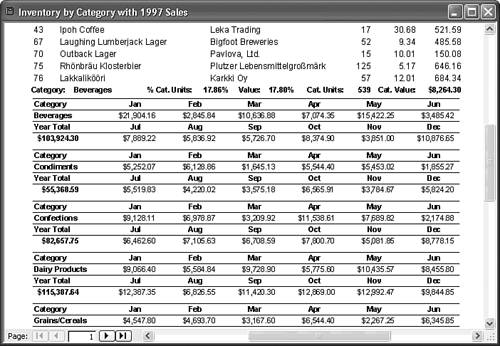 You can add multiple subreports to an unbound report if all the subreports fit on one page of the report or across the page. In the latter case, you can use the landscape printing orientation to increase the available page width. To create an unbound report with previously created multiple subreports, follow these steps:  Click the Reports shortcut in the Database window, if necessary, and then click the New button to display the New Report dialog. Click the Reports shortcut in the Database window, if necessary, and then click the New button to display the New Report dialog.
Keep the text element of the combo box for the New Report dialog's data source blank, select Design View in the list, and then click OK. This action creates an unbound report. Click the toolbar's Database Window button to display the Database window and then drag the Report icon for the first subreport to the blank form's Detail section.  Drag the Report icon for the second subreport to the blank form's Detail section. If the two subreports fit vertically on one page, place the second below the first. If either subreport requires more than a page, place the second subreport to the right of the first. In this case, you must add column labels for the subreports in the main report's Page Header section so that each page identifies the columns. Drag the Report icon for the second subreport to the blank form's Detail section. If the two subreports fit vertically on one page, place the second below the first. If either subreport requires more than a page, place the second subreport to the right of the first. In this case, you must add column labels for the subreports in the main report's Page Header section so that each page identifies the columns.
Tip   | You can also add subreports to a report by using the Toolbox's subform/subreport tool. Use the procedures for adding subforms that you learned in Chapter 15. |
|