Adding Embedded Subreports and Subforms to Reports
3 4
The usual way to create a report displaying data from linked tables (described in the section "Using Grouped Reports") is to create a query based on the linked tables and then use the Report Wizard to create a grouped report. However, you can also create a report that has one or more linked or unlinked subreports, each of which is itself a report. You can also add a subform to a report. You create a report that has a subreport in much the same way that you create a form that has a subform. The main report is linked to the "one" table, and the subreport or subform is linked to the "many" table.
Simulating a Datasheet Subreport with a Datasheet Subform
If you need to display linked data in a datasheet format, a main report containing an embedded datasheet subform is the easiest solution. You can place forms on reports (but not vice versa), so you can create a datasheet form and place it on a report.

Using the Crafts database as an example, follow these steps to create a main report for authors with a linked datasheet subform listing the books by each author:
- Create a datasheet form based on the two linked tables, tblBooksAndVideos and tblBookAuthors.
- Save the form with the LNC tag fsub to indicate that it’s intended for use as a subform.
- Create a report in Design view based on tblAuthors.
- Open the Sorting And Grouping dialog box and create an Author group header and footer for the report, using the LastNameFirst field. Set the KeepTogether property to Whole Group, as shown in Figure 7-40.
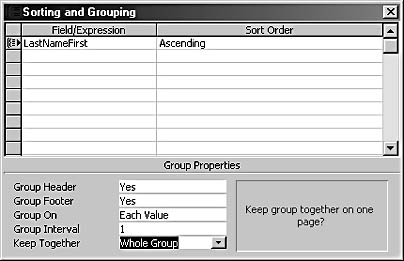
Figure 7-40. Create an Author group by using the LastNameFirst field.
- Place the LastNameFirst field in the group header, and format it for a large font, including an underline if you want.
- Add a text box to display the report’s caption in the page header section of the report. Set the control source as follows:
=[Caption]
This technique ensures that the title displayed on the report will match the report caption.
- Drag the datasheet subform to the report’s detail section.
- Adjust the size of the subform so that each column’s full width is displayed.
- Set the ForceNewPage property of the LastNameFirst group footer to After Section, ensuring that each author’s information starts on a new page.
Figure 7-41 shows the Books With Authors report, with the datasheet subform displaying the author’s books.
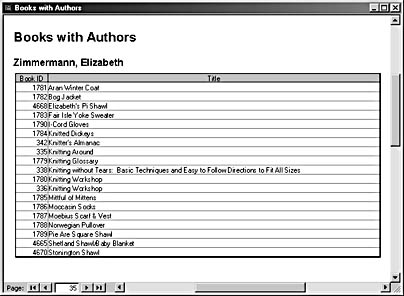
Figure 7-41. This report contains a datasheet subform displaying linked data.
Multiple Subreports
The main table in the Crafts database, tblBooksAndVideos, is linked to three other tables in one-to-many relationships. The standard grouped report format, based on a query that includes all the linked tables, might not be the most useful report format for a report with multiple one-to-many relationships. An alternative is to create one subreport for each linked table, with the main report linked to the "one" table.
In this section, you’ll learn how to create a main report for tblBooksAndVideos with three linked subreports for tblAuthors, tblSources, and tblSpecialties. The general principles can be applied to any report that needs to include data from two or more "many" tables linked to a "one" table.
Each of the linked tables needs a simple report with just one control. The data source for each subreport can be just the linking table (the table that links the "one" table to the "many" table) if the linking table contains a field with the data to be displayed in the report. For example, rsubBookSpecs is bound to tblBookSpecs, and it has just one control, a text box bound to the Specialty field. The rsubBookSource subreport is similar, and rsubBookAuthors also has tblAuthors in its record source because the author’s name needs to be placed on the subreport.
You can either specify the matching record on the main report using a criterion in the subreport’s record source query or SQL statement (as shown in Figure 7-42) or leave the record source unfiltered and link the subreport to the main report by entering the BookID field as the setting for the LinkChildFields and LinkMasterFields properties of the subreports. The second technique is recommended if you want to use the same subreports on several reports, to avoid errors in referencing the main report by name in the record source criterion.
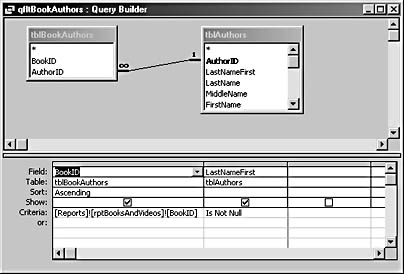
Figure 7-42. A filter query is used as a subreport’s record source.
The subreports can be placed wherever they are needed on the main report. In the rptBooksAndVideos report in the Crafts database, rsubBookAuthors is placed in the Title header and rsubBookSource and rsubBookSpecs are placed in the Title footer. Figure 7-43 shows this report in Design view.
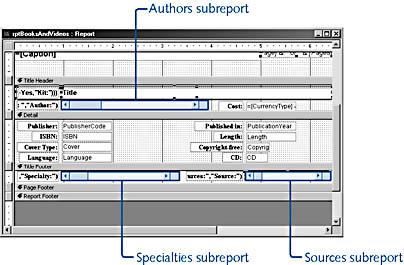
Figure 7-43. The rptBooksAndVideos report is shown here with subreports in Design view.
Figure 7-44 shows the report in print preview, displaying a book with multiple authors and specialties.
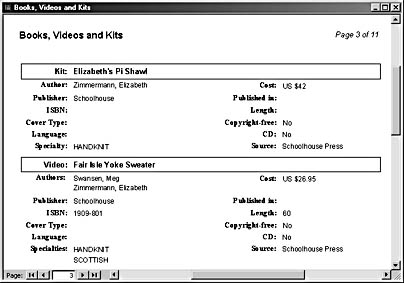
Figure 7-44. The rptBooksAndVideos report is shown here with subreports in print preview.
A report with multiple linked subreports can also be laid out like a worksheet, with the subreports arranged in columnar fashion in the detail section of the report. You can also embed unlinked subforms or subreports in a main report. For example, you might want to display reference data that applies to the entire report. In this case, the unlinked subreport will usually be embedded in the report header or footer, or possibly the page header or footer.
PivotChart Subreports
PivotChart reports are much easier to create and modify than chart reports, so it’s preferable to use a PivotChart subform on a report rather than create a chart report.
To create a PivotChart report, follow these steps:
- Create a PivotChart form. (If you need help creating a PivotChart form, see Chapter 12, "Using PivotTables and PivotCharts to Analyze Data."
- Set the form’s default view to PivotChart on the form’s properties sheet.
- Clear the Field Button/Drop Zones check box on the Show/Hide tab of the PivotChart’s properties sheet. (These interactive elements aren’t needed on a printed PivotChart.)
- Select each axis title in turn, and open the properties sheet. On the Format tab, enter the new caption for each axis, as shown in Figure 7-45. You can also change the font attributes on this tab.
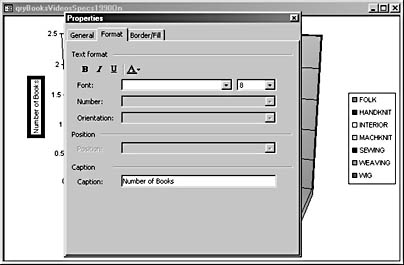
Figure 7-45. Enter axis titles for a PivotChart intended for use on a report.
- Save the form with the LNC tag fsub to indicate that it will be used as a subform.
- Create a blank unbound report.
- Drag the subform to the report grid in Design view, as shown in Figure 7-46.
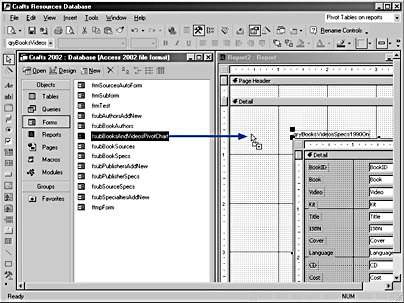
Figure 7-46. Drag the PivotChart subform to a blank report in Design view.
- Delete the subform’s label—you don’t need it. If you want, you can add a label with a title for the chart in the report header section.
- Move and resize the subform control as needed to suitably display the chart.
Figure 7-47 shows the finished report with a PivotChart. PivotChart subforms don’t display very well in print preview, but they are perfectly clear when printed.
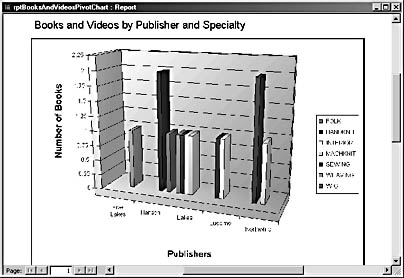
Figure 7-47. The finished PivotChart report in print preview looks like this.
tip - Print a PivotChart form
Instead of creating a report containing a PivotChart subform, you can simply print the PivotChart form after removing the interactive display elements. This is the only situation I can think of in which printing a form might be useful. However, you can’t control the size of the chart when you print it directly from a form—it will be the full height of the page, which might not be the best layout for your purposes.
PivotTable Subreports
You can create a report with an embedded PivotTable by using the same general technique you used with a PivotChart. Even though you can’t actually pivot a PivotTable when it is embedded on a report, there’s still an advantage to using a PivotTable instead of basing a report on a crosstab query: Using a PivotTable subform on a report ensures that the column headings will always remain accurate after any changes to the data. On the other hand, there is no guarantee that you’ll be able to see all the columns. If they extend beyond the width of the report, the extra columns will be cut off.
Figure 7-48 shows a report based on a PivotTable, using the same underlying data used for the crosstab report shown in Figure 7-39.
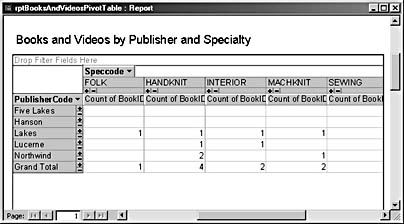
Figure 7-48. This report contains a PivotTable subform.
EAN: 2147483647
Pages: 172