Project-Management Principles, Methods, and Practices
| The organization must include formal project-management techniques in addition to the SDLC to ensure that the software-development project meets the stated objectives. The project-management team should follow the phases of the project life cycle (initiating, planning, executing, controlling, and project closing). The project-management team should develop a detailed plan and report all project activity against the plan, to ensure corrective action where needed. The software-development project should be assigned a project manager who is experienced in the area of software development and has skills associated with managing projects. The successful use of sound project-management techniques will help ensure a successful implementation and minimize the risk of failure because of late delivery, cost overruns, lack of functionality, or poor quality. During the planning phase, the project-management team should set the time, cost, and scope of the project. In developing the project plan for a software-development project, the project-management team must determine the relative physical size of the software to be developed. In a software project, the planning team and project manager should determine the relative physical size of the software to be developed; this can be used as a guide for allocating and budgeting resources. The project-management team can use function point analysis (FPA) to provide an estimate of the size of an information system based on the number and complexity of a system's inputs, outputs, and files. Per ISACA, function points (FPs) are computed by first completing a table (see Table 6.2) to determine whether a particular task is simple, average, or complex. There are a total of five FP count values, which include the number of user inputs, user outputs, user inquiries, files, and external interfaces. Table 6.2 shows the formula for computing FP metrics.
Organizations that use FP methods develop criteria for determining whether a particular entry is simple, average, or complex. After the table entries are completed, the organization can use the count totals and compute them through an algorithm. The results of this computation, which takes into account complexity values specific to the organization, are used to measure cost, schedule, productivity, and quality metrics (that is, productivity = FP/person-month, quality = defects/FP, and cost = $/FP). When the size of the software-development project is determined, the project team should identify the resources required to complete each task. The project team then should develop a work breakdown structure that identifies specific tasks and the resources assigned those tasks, as well as project milestones and dependencies. The team should create Gantt charts to show timelines, milestones, and dependencies. A Gantt chart is a graphic representation of the timing and duration of the project phases; it typically includes start date, end date, and task duration.
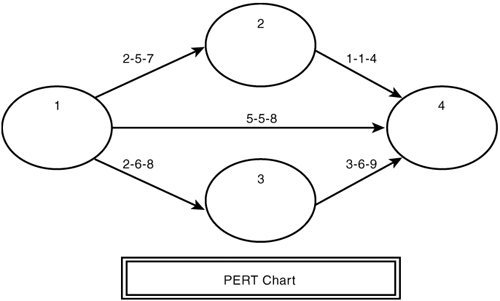
Determining time and resource requirements for an application-development project is often the most difficult part of initial efforts in application development. In addition, the project team should perform a program evaluation review technique (PERT). PERT is the preferred tool for formulating an estimate of development project duration. A PERT chart depicts task, duration, and dependency information. The beginning of each chart starts with the first task, which branches out via a connecting line that contains three estimates:
The line then is terminated to another node (identifying the start of another task). The chart is completed by connecting predecessor to successor from a network of tasks and connecting lines. The completed chart should depict all tasks coming together at the completion node. All tasks, including milestones, review points, and checkpoints, should be depicted on the chart to correctly estimate the total time associated with the plan. Figure 6.3 depicts an example of a PERT chart. Figure 6.3. A PERT chart. The calculation of PERT time uses the following formula: Optimistic + pessimistic + (4 x most likely) / 6 So if you wanted to calculate the PERT time for the project using task 1 terminating at 2, you would apply the formula in this manner: Task 1 to 2 (2 + (4 x 5) + 7) / 6 = 4.8 The numbers represent days, so the PERT time for task 1 would be 4.8 days.
PERT considers different scenarios for planning and control projects. After the project teams complete the project plan, they should monitor the progress of the project against the baseline plan using benchmarks, milestones, and deliverables. Any deviations from the plan must be addressed immediately to ensure that the project does not exceed the time and cost estimates. Many factors can affect the time, cost, and, ultimately, success of a project. And IS auditor can look for some risk indicators in reviewing the project plan and implementation. The Critical Path Methodology (CPM) is a project-management technique that analyzes successive activities within a project plan to determine the time required to complete a project and which activities are critical in maintaining the schedule. Critical activities have the least amount of flexibility, meaning that the completion time cannot be changed because it would delay the completion of the overall project. The successive critical activities are known as the critical path. The computation of all successive activities along the critical path predicts the required time to complete the project. The critical path of a project can be graphically represented with a diagram showing the relationship of critical activities. The following are project planning risk indicators:
| ||||||||||||||||||||||||||||||||||||||||||||||||||||||


