15.1 Day-to-day performance
| Performance tuning aims to satisfy service level agreements that reflect users' requirements pertaining to performance. A key advantage of running Linux on the mainframe is the decades of experience developing the right knobs and meters for performance tuning. These well-documented knobs and meters are equally valuable for providing the insight for performance tuning in the new server consolidation Linux-on-the-mainframe world. The knobs are the parameters that the analyst changes and the meters are the reports by which the analyst can observe the effects of the parameter changes. These knobs and meters are realized with the various performance management tools. Performance measurement and tuning are costly. Why would you do it, and when is a good time to do it? In a server farm environment, when the cost of purchasing a new system is often less than the cost of measurement, it might not be necessary to take any measurements. However, in a Linux-on-the-mainframe environment, it might be a good idea for the following reasons:
For these and other reasons, a mainframe installation requires both real-time monitoring and analysis as well as a structured methodology for capacity planning. z/VM has the built-in tools to monitor and collect performance data and other data that you can use for billing, input to capacity planning, analyzing bottlenecks, and tuning purposes. See Chapter 26, "Performance Reference," for more details about the available tools. 15.1.1 Performance metricsMany metrics are used for performance tuning and capacity planning. The following metrics are easily available with Linux on the mainframe and might help you to manage your SLA in accordance with agreement: Response timeThis is a measure of the time taken to perform a certain task, such as running a specific job. Response time is related to external throughput rate (ETR). CPU utilizationThis is a measure of how busy the processor is over any given period of time, for example, 24 hours. To obtain maximum return on investment, it is usual to purchase a system whose capacity matches the requirements as closely as possible plus whatever near-term growth is expected during this budget cycle. CPU utilization is a factor in the internal throughput rate (ITR). Memory utilizationThis is a measure of how the real memory and the individual guest virtual memory are used, and is typically derived from page usage rates. I/O utilizationI/O utilization covers two areas: the utilization rates of paths and devices and the amount of disk space currently in use. High I/O rates are usually symptomatic of a fixable problem. For a discussion of I/O aspects of performance, see 14.6, "Performance tuning and capacity planning." Interactive usersThe number of users that are supported in a unit of time. One use of this number is to cap the number of users allowed to be logged into the systems at the same time in order to guarantee an agreed-to ETR. ConsistencyErratic system behavior can cause considerable user dissatisfaction. Thus consistency of response time, I/O service time, and so forth are important considerations for most installations. ThroughputThis is work that is done per unit time, and you can measure it in different ways:
If you are trying to understand the experience of your end user, you look at the ETR. If you are planning capacity, or looking at rehosting an application, you would look at ITR numbers. You might also want to have the supporting data that show how CPU, memory, and I/O utilization influence throughput. 15.1.2 Data collectionGathering the right amount of data has always been a key challenge to any service provider. With Linux on the mainframe, one of the "knobs" that can be adjusted is the set of data to be captured and logged. Data collection provides the facts that many decisions in performance management rely on. Collected data are used in the following activities:
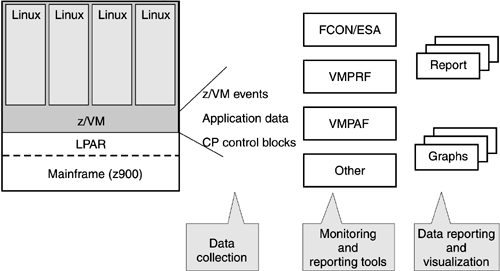
Data collection typically presents two questions for administrators: what data to collect and how much data to collect. Each question can impact the running of the environment unfavorably. Collecting data costs machine cycles, extra I/O operations, and disk and tape space. The only thing worse that not collecting performance data is collecting too much. With Linux on the mainframe, there are two places where you can collect data: within each Linux image itself and in z/VM. The least expensive place to collect data, from a resources and management view, is z/VM because it already has significant data on each guest. The typical Linux image is running only one function. So whether you gather usage data, such as memory or CPU behavior, from the Linux image itself or from the virtual machine, the information is effectively the same and will give a correct picture for most cases. Thus z/VM provides the "meters" for resource consumption. z/VM also has immediately available the "knobs" for making adjustments to either the runtime image itself for immediate effect or the guest definitions to take effect at later boots. In a typical server farm environment, you might set up the performance tool to have clients in each application server and a separate server for the performance tool itself. The clients run in each Linux image, thus adding to the workload of that image. The client is responsible for forwarding data to the server for logging and other uses. Alternatively, the client or operating system image does its own local logging. Using z/VM as your primary performance data collecting tool, you avoid adding a performance tool client in every image. z/VM allows you to monitor the performance and collect data for each guest (Figure 15-2). The measurement does not add to the load of the guest, and thus you get more correct data about the load of the guest when you use z/VM. You also save the additional LAN traffic out of each of the guests. Figure 15-2. Data collection in a Linux-on-the-mainframe environment with the help of z/VM
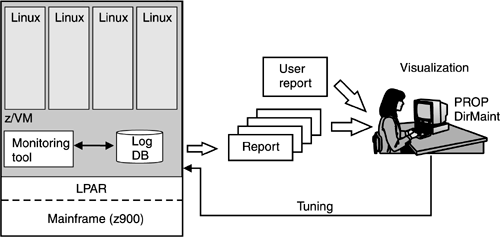
VM has been enhanced over the years to support, manage, and monitor hundreds, even thousands, of guests. VM tools available for data collection and monitoring include the VM Performance Reporting Facility (VMPRF), VM RealTime Monitor (RTM), and the VM/ESA Full Screen Operator Console and Graphical Real Time Performance Monitor (FCON/ESA). For short descriptions of these tools, see 26.3.3, "Monitoring tools." If there is a need to monitor performance or collect data inside the Linux guest, you can still use Linux tools, as described in 26.3, "Performance tools." 15.1.3 Hardware tuning and software tuningHardware and software tuning is about extracting even more value from the Linux-on-the-mainframe consolidated environment. Hardware tuning in a Linux-on-the-mainframe environment means tuning the virtual hardware on which the Linux images reside. This tuning mainly consists of giving the Linux images the virtual resources they need, such as a larger CPU share or more memory. This type of tuning is more flexible than tuning real hardware, because there is no need to take the machine down, for example, to add more memory to an image. A benefit of collecting data in z/VM is that the means for adjusting the resources are also in z/VM. Were you to collect data in Linux itself, some analysis would have to take place to correctly remap that data into z/VM terms. Figure 15-3 shows performance monitoring and tuning schematically. The monitoring tool moves the data to a log stream. The log stream, depending upon current settings, provides the data to any registered "listener" and to a file for permanent record. Report applications can be run off the real-time stream, but most often read the log file. Visualization most often looks at the real-time stream. Automation tools subscribe to the log stream for some of their data. Reporting applications create the user reports. A system administrator can change parameters depending on the data. Figure 15-3. Performance tuning
While hardware tuning gets you better use of resources, by fine tuning z/VM you might get even more effective resource use out of the virtual hardware, for example, allow for more guests. Software tuning in a Linux-on-the-mainframe environment can generally be summarized as: first do standard z/VM tuning, then do standard Linux tuning. z/VM presents the architecture very effectively to the guest. In general, this means the guest does not need to know that it is running on virtual hardware. Only if you have done standard tuning and want to improve performance further should you look at the potential interactions between guest tuning and virtualization tuning. The best starting area for analysis would be where the same ideas and techniques are used by both z/VM and Linux, such as paging and memory usage or I/O buffering. Consider data buffering as an example. What part of the system owns which buffer and how the various buffers interact is important to system tuning. In Linux on the mainframe, you can specify the buffer management to be at a layer closer to the data store, and that saves Linux and its applications from having to be specifically configured to manage I/O performance. Using z/VM tools (a preferred tool is DirMaint), a system administrator can make changes to the virtual hardware configuration in a matter of minutes, validate solutions, and visualize results. For some tuning tips for this environment, refer to 26.1, "Tuning Linux guests under VM." 15.1.4 Data visualizationPerformance data lend themselves to presentation schemes varying from the simple red-green status displays of health monitors to some very complex graphing. Graphic displays often make it easier to get insight than when reading a table of numbers. System administrators will probably want to use visualization tools to analyze real-time performance problems as well as to review collected data. Tools from the Open Source community, IBM, and other vendors provide the real-time visualization capabilities that allow a skilled administrator to track down the root cause of a performance problem. And with z/VM the analyst could even make dynamic changes to a given guest's environment to attempt an immediate "repair." |
EAN: 2147483647
Pages: 199