Section 7.3. JavaScript Debugging Tools
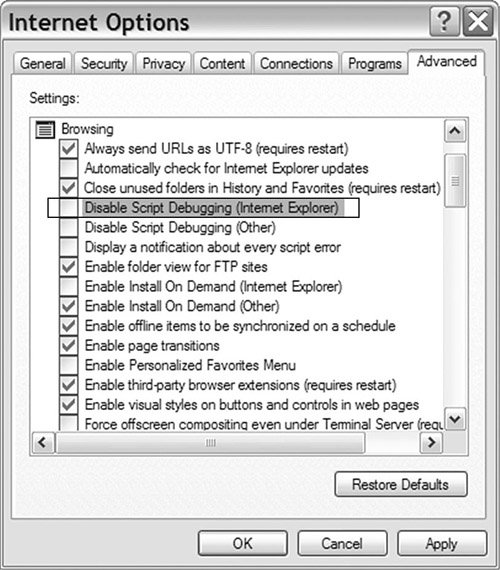
7.3. JavaScript Debugging ToolsThe tools we've looked at so far are good at giving you a picture of the communication between the client and the server, but they're not a huge help if the bug is somewhere in your JavaScript code. JavaScript isn't known for having a large number of tools to help the developer, and if you're working with Internet Explorer, that lack of tools is still true; however, Firefox (and other browsers) gives you a lot of tools that are helpful with debugging and developing JavaScript. For instance, the most basic Firefox development tool is the JavaScript console (see Figure 7-17). Any JavaScript errors are shown in it, and clicking one of them will show you the line in your code where the error happened. You can view the console by selecting it from the Tools menu; it's labeled either JavaScript Console or Error Console, depending on your Firefox version. (Note that a number of Firefox extensions, including Firebug, provide quicker access to this information.) Figure 7-17. Firefox JavaScript Console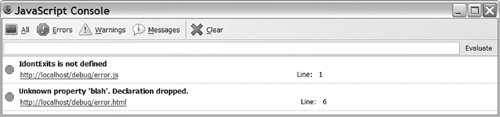 Out of the box, Internet Explorer gives you a particularly hard time debugging JavaScript because it doesn't provide correct lines numbers when external files are used. The solution to this is to install the Microsoft Script Debugger (www.microsoft.com/downloads/details.aspx?FamilyID=2f465be0-94fd-4569-b3c4-dffdf19ccd99&DisplayLang=en). After you install the debugger, you need to turn it on. To do so, follow these steps:
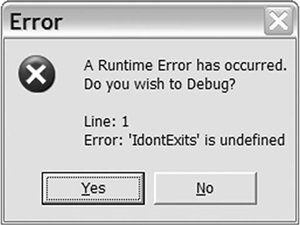
Figure 7-19. Script Debugger Error dialog box The basic debugger interface is shown in Figure 7-20. From this screen, you can step through the code using the Debug menu, just as with any other debugger. The debugger has two main drawbacks: It creates a popup dialog box for each JavaScript error that has to be dealt with, and it tends to become unstable when actually using it for debugging. That being said, the Script Debugger quickly gives you the actual line where JavaScript errors happen, which is a big advantage over the normal IE error message. Figure 7-20. Basic Script Debugger interface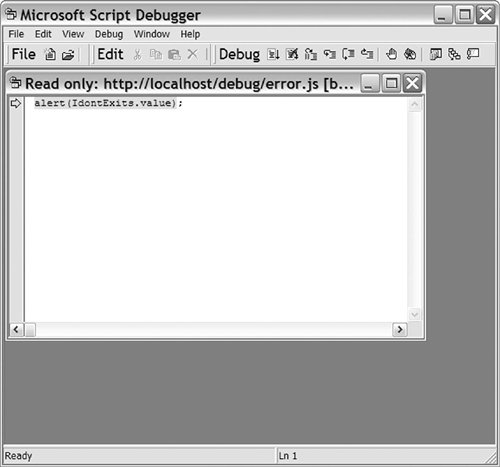 |
EAN: 2147483647
Pages: 154