Understanding Flowcharts in Visio
3 4
What is a flowchart? In Visio terms, it's any of several templates stored in the Flowcharts folder that you can use to create a connected diagram. Most flowcharts (also called flow sheets or flow diagrams) include text and lines that imply a process or order, but such a simple explanation doesn't adequately express the variety of diagrams that you can create, as Figure 9-1 shows. A flowchart can schematically represent items in a structure, steps in a process, or a chronology. For example, you can use a flowchart to depict the sequence of operations in an accounting system, departmental interdependencies in a new process, or the steps that contributed to the fall of the Roman Empire. To Visio, they're all types of information that a connected diagram, or flowchart, can convey.
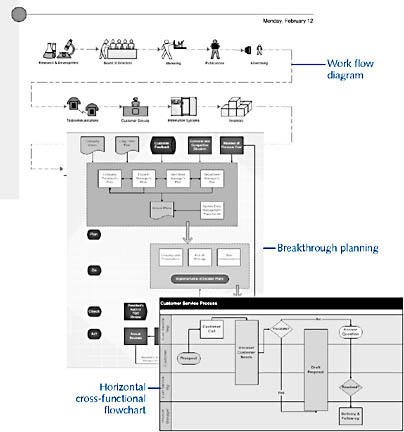
Figure 9-1. You can use a flowchart template to create a variety of diagrams, all of which organize information in a sequence or hierarchy.
Choosing a Flowchart Template
Visio includes several flowchart templates, each designed for a different purpose. Which one should you use?
- Basic Flowchart. Use this template if you're documenting a process from beginning to end, or organizing information hierarchically.
- Cause And Effect Diagram. Use this template to create fishbone diagrams that illustrate all the factors that result in a particular goal or problem.
- Cross-Functional Flowchart. Use this template to show the interrelationship between different areas of your organization as they relate to a process.
- Audit Diagram. Use this template to document accounting or bookkeeping practices.
- Mind Mapping Diagram. For brainstorming or problem-solving, use this template, which is based on the research of Tony Buzan. For details about his work, see http://www.buzancentre.com/thinking.html.
- Total Quality Management Diagram. This template creates documentation for Total Quality Management (TQM) initiatives. TQM diagrams provide a way to document policies and processes as part of an ongoing organizational effort toward improving and controlling quality.
- Work Flow Diagram. Use this template to depict high-level task management. For example, you can diagram an ideal work flow that minimizes material handling costs, uses space and labor efficiently, and eliminates bottlenecks.
To start a new flowchart based on one of these templates, choose File, New, Flowchart, and then select the type of diagram you want to create.
The rest of this chapter describes how to create flowcharts using the Basic Flowchart, Cause And Effect, and Cross-Functional Flowchart templates. All the other flowchart types are created using similar techniques. For help getting started with audit, mind map, TQM, or work flow diagrams, refer to Visio Help.
Tip - Display Flowchart Help
To display a help topic about a specific flowchart type, choose Help, Microsoft Visio Help, and then click the Contents tab. (If it isn't visible, click the Show button.) In the Contents pane, expand Drawing Types, expand Flowchart, and then expand the topics for the type of flowchart you want to create.
Additional Flowcharts and Process Diagrams in Visio Professional
An entire industry has arisen to support business and data modeling, which encompass a variety of theories and methodologies for streamlining business and engineering practices. Visio Professional provides additional flowchart templates for the following:
- For structured analysis and design using the techniques of Gane and Sarson as well as Yourdon and DeMarco, use the Data Flow Diagram template (shown in Figure 9-2). To model data flows using the Gane-Sarson DFD notation, use the Data Flow Model Diagram template in the Software folder. For details, see "Using the Data Flow Model Diagram Solution."
- To create charts based on the CCITT Specification and Description Language (SDL), use the SDL Diagram template. SDL is a symbol set used to specify event-driven systems. Because it can represent concurrent, real-time processes, it is widely used to represent telecommunication systems and design data communication protocols. CCITT is the International Telegraph and Telephone Consultative Committee.
- For process modeling and functional analysis based on the IDEF0 methodology, use the IDEF0 Diagram template (also shown in Figure 9-2). The IDEF0 notation is used to create function models, a graphical depiction of systems and process decomposition based on the Structured Analysis and Design Technique (SADT).
Although the methodologies underlying the data flow, SDL, and IDEF0 shapes impose rules for their use, Visio doesn't check for errors with these diagram types.
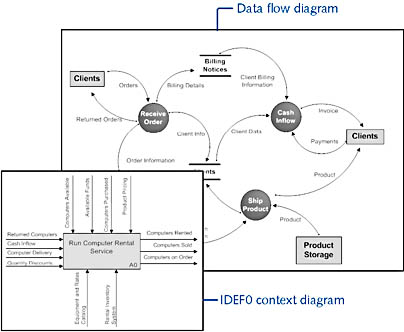
Figure 9-2. Visio Professional includes templates for creating diagrams based on business and process modeling methodologies.
EAN: 2147483647
Pages: 211