Creating Reports
3 4
If shapes have custom property fields in which you have entered data, you can generate a report that includes selected properties and values. Visio includes a number of predefined reports that you can use for specific types of information, such as asset reports, or you can create your own report and define its contents. What a report looks like depends on what you put in it and how you want to save it. Visio can save a report as an external file in XML format (with the file extension .vrd) or as a table shape on the drawing page that's linked to the information.
Note
In earlier versions of Visio, you could use the Property Reporting Wizard to create inventory and asset reports. This wizard is no longer included in Visio. It has been replaced by the Reports command on the Tools menu.
To set up a new report or run an existing one, you use the Report command on the Tools menu. The Report tool lists existing reports that you can run or modify, as Figure 6-13 shows, or you can define your own reports. Because the Report tool is meant to be a design tool, its contents vary depending on whether anyone has created new reports for you to run. Visio Standard and Visio Professional come with different built-in reports for specific diagram types. For example, Visio Professional includes a report called the Door Schedule, which a builder or architect might run to show all the door specifications in a floor plan. You can even customize any of the built-in reports to tailor the report to your needs.
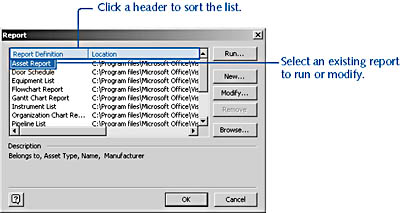
Figure 6-13. With the Report tool, you can create new reports based on the custom property data in your drawing, or you can run one of the existing reports.
Note
By default, the Report tool lists any report definitions (*.vrd) stored in the \Samples\Visio Extras folder as well as any of the Visio drawing paths.
Running a Report
Many Visio solutions include predefined reports that you can run to evaluate the data stored with a drawing. For example, a flowchart report tabulates cost, duration, and resources associated with the shapes in a flowchart. A door schedule lists all door specifications for a building plan. Table 6-3 lists the predefined reports that are included with different templates. To run a report, you use the Report command on the Tools menu, and then specify the output format you want.
Visio can create the report's contents as a table shape on the drawing page, or it can save your report as an external Microsoft Excel, HTML, or XML file.
Table 6-3. Built-in Report Definitions
| Visio Standard Report | What It Does |
|---|---|
Flowchart Report | For flowchart shapes, lists the text displayed on flowchart shapes as well as the values of the resources, cost, and duration custom properties sorted by shape. |
Gantt Chart Report | For each resource in a Gantt Chart shape, lists the task name, start date, end date, duration, user- defined number, and percent complete. |
Organization Chart | For each department, lists the employee name, title, and Report telephone number. |
Shape Inventory | For all the shapes in any diagram, lists the text displayed on shapes, and each shape's height, width, and location on the page (as x and y coordinates). |
| Visio Professional Report | What It Does |
Asset Report | For shapes in a floor plan, space plan, or office layout, shows who owns an asset (the Belongs To field), as well as the asset type, name, and manufacturer. |
Door Schedule | For door shapes in a floor plan, space plan, or office layout, lists the door number, size, type, and thickness. |
Equipment List | For equipment components in a process engineering diagram, lists the tag, description, material, manufacturer, and model. |
Instrument List | For instrumentation components in a process engineering diagram, lists the tag, description, connection size, service, manufacturer, and model. |
Pipeline List | For pipeline components in a process engineering diagram, lists the tag, description, line size, schedule, design pressure, and design temperature. |
Space Report | For shapes in a space plan, lists the department, room number, use, and area. |
Valve List | For valve components in a process engineering diagram, lists the tag, description, line size, valve class, manufacturer, and model. |
Window Schedule | For window shapes in a floor plan, space plan, or office layout, lists the window number, size, and type. |
To run a report, follow these steps
- Choose Tools, Report.
The Report dialog box appears and displays all the predefined reports in the Report Definition list. Different reports will appear depending on whether you have Visio Standard or Visio Professional.
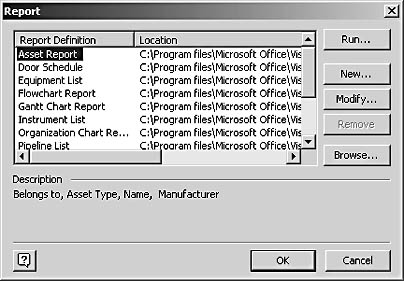
- Under Report Definition, select Asset Report, and then click Run.
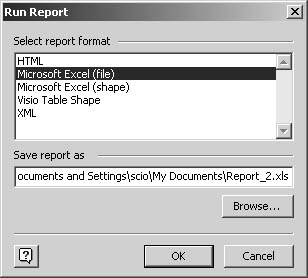
- In the Select Report Format box, select an output format.
If you choose Microsoft Excel (File), HTML, or XML, specify a name for the report file that Visio creates in the folder you want. If you choose Microsoft Excel (Shape) or Visio Table Shape, choose whether to link shapes to the report definition or save a copy of it with the shapes.
- In the Run Report dialog box, click OK.
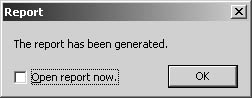
Visio displays a progress indicator as it generates the report. If the output is an external file, Visio displays a message when it has created the file. Click OK to read the report later, or select the Open Report Now check box to open your browser with a copy of the report.
If the output is a table shape, Visio creates the shape and adds it with the custom property information to the current page.
- In the Report dialog box, click OK or choose another report to run.
Troubleshooting
When running a report, Visio displays a message that no shapes had the selected properties or satisfied the report selection criteria.
Visio displays an error message and cancels the report if the shapes in your diagram do not contain custom properties, or contain different custom properties than specified in the report definition. To see which properties are specified by a report, select the report name and then choose Modify in the Report dialog box.
Defining a Custom Report
You can define a new report from scratch or based on an existing report definition. In the report definition, you specify whether the report will include all or some of the custom properties stored with your shapes. In addition, you can set up your report to run for all the shapes on a page or all the shapes in the drawing file.
To create a new report definition, choose Tools, Report, and then click the New button, or select an existing report definition and click the Modify button. When you create a new report or modify an existing one, the Report Definition Wizard walks you through the steps. Visio stores your report definition as a .vrd file in the location you specify and adds it to the list in the Report dialog box.
To define a new report, follow these steps:
- Specify whether to report on all shapes in the file or just on the page.
- Select the properties you want to include in the report. In addition to custom properties, your report can include other internal properties that Visio tracks for shapes, as Figure 6-14 shows.
- Specify how to filter the data for your report. The Report tool reviews all the custom properties, including hidden properties created for the solution and user-defined properties in the ShapeSheet. You probably don't want all this information in your report, so you can select just the properties you do want.
- Choose how to format the report. You can group, sort, and specify output formats for the custom property fields and their values.
- Choose whether to save the report definition as part of the current drawing file or as a report file (.vrd) that can be run from other Visio drawing files. When you save a report definition with your drawing, you can run the report whenever you open the drawing.
Note
These steps create the report definition—Visio does not run the report. You can do that next or run it later using different data.
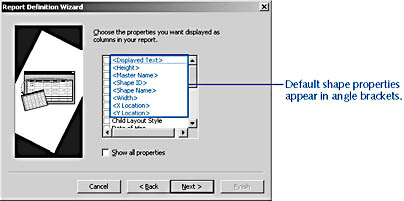
Figure 6-14. When you set up a report, Visio lists not only the shapes' custom property fields, but also default shape properties and internal properties used by the solution called user-defined properties, which appear in the ShapeSheet's User-Defined Cells section.
Selecting Report Contents
Defining a report starts with the decision about which shapes and properties to include. The Report Definition Wizard includes a Limit Selection option that lets you filter properties according to criteria you define, as Figure 6-15 shows. You can choose to include any of the following in a report:
- Shapes on a particular layer
- Shapes that include a particular custom property
- Shapes that include a custom property with a particular value
- Shapes that include a particular user-defined cell value
- For network diagrams in Visio Professional, device shapes that result from the AutoDiscovery command
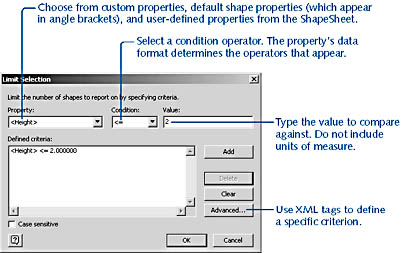
Figure 6-15. You can specify quite precisely the set of shapes and properties to report on by defining criteria in the Limit Selection dialog box. When you run a report, Visio includes only the shapes whose properties meet the criteria in the finished report.
In the Limit Selection dialog box, you use a generic query language to specify the criteria for shapes to include in your report. If you've used any of the typical spreadsheet or database query operations, the options here should look familiar. You select a property that you want to use in a comparison, specify an operator (such as =, <>, >, <, >=, or <=), and then type a value to compare against. Depending on the property and condition operator, the value can be true or false or a number. For strings, the comparison criteria is case sensitive or case insensitive. For example, you can filter your report so that it looks only at shapes where the Height property is greater than 2 inches.
If you're looking for more precise filtering criteria, you can write your own. Click the Advanced button to use an XML pattern string to specify the criteria you want to use. If you're not an XML expert, you may be out of luck until a future release, when enhanced filtering options will be provided, according to Visio product managers.
Formatting a Custom Report
After you've selected the shapes and properties you want to include, you can specify how to organize the information in your report. The Report Definition Wizard includes options for specifying how to group, sort, and format data, as Figure 6-16 shows. Visio can group the output by master name or by custom property, and then show totals and subtotals for each property as well as other standard calculations (count, total, average, median, minimum, maximum).
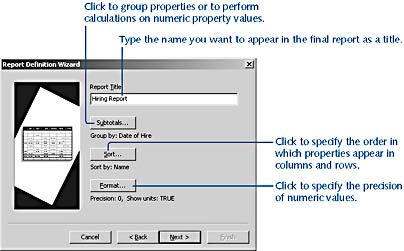
Figure 6-16. In the Report Definition Wizard, you can choose how to organize the contents of your report.
Performing Calculations on Report Contents
To group subsets of data and calculate new values from the data in the individual groups, as shown in Figure 6-17, use the options (listed in Table 6-4) in the Subtotals dialog box, which appears when you click the Subtotals button.
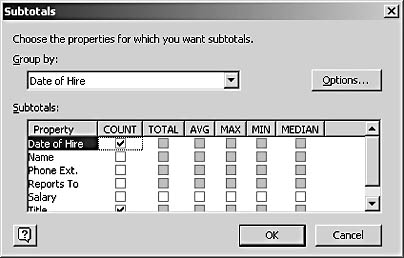
Figure 6-17. You can perform calculations on groups of data.
Table 6-4. Options in the Subtotals Dialog Box
| Option | What It Does |
|---|---|
Group By | Lists all properties. If you select a custom property, report values are grouped according to the values of the selected property. In technical terms, this option is the equivalent of a GROUP BY clause in SQL. |
Options | Displays the Options dialog box, where you can choose to show all values for the group, not repeat identical values, show only subtotals with a group, and show grand totals. |
Property | Lists the properties you've selected to appear as columns in your report. For each property, you can select a calculation. If the calculation is not valid for the type of data represented by the property value, the option's check box is displayed in gray. |
Count | Calculates the number of objects with a particular value for the property. |
Total | Calculates the sum of the list of property values. |
Avg | Calculates the average (arithmetic mean) of the property values. |
Max | Calculates the largest number from the list of property values. |
Min | Calculates the smallest number from the list of property values. |
Median | Calculates the median of the property values. The median is the number in the middle of a set of numbers; that is, half the numbers have values that are greater than the median, and half have values that are less. |
Sorting Report Contents
When you sort a report, you determine the order in which properties are listed in the rows and columns of the final output. To sort a report, click the Sort button in the Report Definition Wizard. In the Sort dialog box, you sort the following:
- In the Column Order list, choose the order that you want the property names to appear across the top of the report.
- In the Row Order options, choose the order in which property values are listed in the body of the report. You can sort a report based on the contents of one or more columns. For example, if your report contains employee information, you can sort based on the hiring date and on the employee names to show who was hired when as Figure 6-18 shows.
Tip
If you need to sort by more than three columns, sort by the least important columns first.
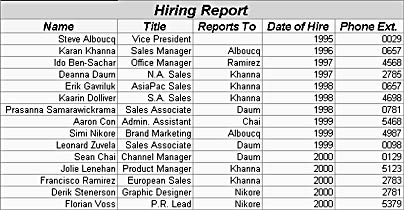
Figure 6-18. This report is sorted in chronological order by date of hire. For each date, employees are sorted in alphabetical order.
Table 6-5 lists the options in the Sort dialog box.

Note
When you create subtotals in a report, the property you specify in the Group By option does not appear in the Sort dialog box as an option.
Table 6-5. Options in the Sort Dialog Box
| Option | What It Does |
|---|---|
Column Order | Lists the properties you've selected to appear in the report. When you run a report, the properties are listed in columns from left to right in the order they appear in this box. You can select a property and then use the Move Up and Move Down buttons to adjust its order. |
Move Up | Moves a property selected in the Column Order box one position higher in the list. |
Move Down | Moves a property selected in the Column Order box one position lower in the list. |
Sort By | Sorts rows in the selected order (ascending or descending) based on the value of the selected custom property, |
Ascending | Sorts values for the property in the Sort By box in ascending (1 to 9, A to Z) order. |
Descending | Sorts values for the property in the Sort By box in descending (9 to 1, Z to A) order. |
Then By | Sorts rows in the selected order (ascending or descending) based on the value of the selected custom property. |
Specifying Numeric Precision for Values
For numeric output, you can specify the level of precision as the number of values to the right of the decimal and whether to include units of measure. In the Report Definition Wizard, click the Format button to display the Format dialog box, which allows you to define the way that the data values are displayed as Figure 6-19 shows. Table 6-6 lists the options in the Format dialog box.
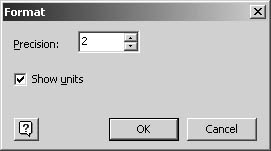
Figure 6-19. For custom property values that specify dimensions, you can specify the precision and display units of measure.
Table 6-6. Options in the Format Dialog Box
| Option | What It Does |
|---|---|
Precision | Applies to numbers only. Enter a value from 0 to 14. |
Show Units | Specifies whether to display units of measure in the final report. |
Saving a Report Definition
The final step in creating a Report Definition is to name the report and indicate where to save it. The Report Definition Wizard provides options for you to save your settings with the current drawing file or as a separate file that can be opened from within other Visio drawings as Figure 6-20 shows.
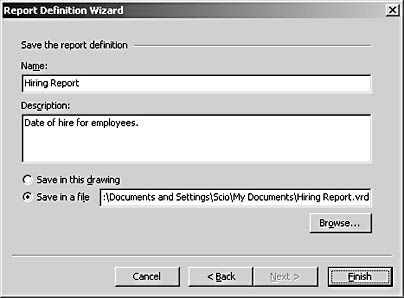
Figure 6-20. You can specify a name and description that appear in the Report dialog box for your new report definition.
Saving a report definition is a two-step process: Click Finish in the Report Definition Wizard, and then click OK in the Report dialog box. If you click Cancel, Visio will warn you that your report definition will be lost. Table 6-7 lists the options in the Report Definition Wizard for saving your report.
Table 6-7. Options for Saving the Report Definition
| Option | What It Does |
|---|---|
Name | Identifies the report definition. The name you type here appears in the Report dialog box. |
Description | Provides identifying information about the report that appears in the Description box of the Report dialog box. The text you type here can act as a prompt, which is particularly useful if others will be running the report, but it's optional. |
Save In This Drawing | Specifies to save the report definition in the drawing file. When you choose this option, you can run the report whenever you open the drawing. If you select Save In A File, this option is not available. |
Save In A File | Specifies to save the report definition as an external report file (.vrd) that can be run from other Visio drawing files. Type a file path and name in the box, or click the Browse button to specify the path. If you select Save In This Drawing, this option is not available. |
Browse | Opens the Report Wizard dialog box, which provides the standard options for saving a file. By default, Visio supplies the name Report_1.vrd for report files and saves them in the My Documents folder. You can type a new name and specify a different folder to save it in. Visio saves report files in .vrd format only. If you select Save In This Drawing, this button is not available. |
When you save a report definition, it is listed in the Report dialog box. To see whether your report definition provides the expected output, you need to run the report. Creating a report definition does not automatically run a report. To do that, select the report name in the list of report definitions, and then click Run.
EAN: 2147483647
Pages: 211