Creating Pipeline, Valve, and Other Reports
3 4
Engineering drawings often accompany reports, such as a bill of materials or parts list. One of the best new features in Visio Professional is its ability to generate reports of all kinds based on the data stored with your drawing. For P&IDs and PFDs in particular, Visio includes several built-in reports that you can run to create components lists based on the custom properties stored with process engineering shapes. If you're working with one of the other engineering templates, the built-in report definitions probably don't apply to your diagram type. However, you can create your own report definitions that include the information you want.
For details about reports, see "Defining a Custom Report."
Generating Component Lists
Visio includes several built-in reports that you can run to create a list of all the pipelines, equipment, instruments, or valves in your process engineering model diagram, as Figure 27-31 shows. The built-in process engineering reports are based on custom property values and include the following lists:
- Equipment List. This report includes tag number, description, material, manufacturer, and model.
- Instrument List. This report includes tag number, description, connection size, service, manufacturer, and model.
- Pipeline List. This report includes tag number, description, line size, schedule, design pressure, and design temperature.
- Valve List. This report includes tag number, description, line size, valve class, manufacturer, and model.
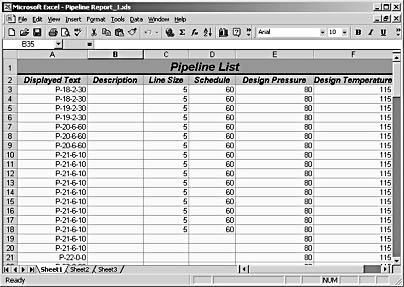
Figure 27-31. The built-in pipeline list report can be generated as a Microsoft Excel file for further analysis. You can also generate reports in HTML, XML, and other formats.
Even if your diagrams don't include custom property data for shapes, you can run these reports to get a list of components by their tag number, because Visio tags process engineering shapes automatically. Reports are easy to customize as well. If you want to display different properties in a report, you can modify the report definition. For example, you can select the Valve List report definition in the Report tool and then edit it so that the Description field is not included.
To generate one of the built-in reports, choose Tools, Report. In the Report dialog box, select a Report Definition, and click Run.
For details, see "Running a Report."
Customizing Process Engineering Reports
To make reports more useful for your process engineering group, you can also create customized reports. You can either modify an existing report definition or create one from scratch. The built-in report definitions (Equipment List, Instrument List, Pipeline List, and Valve List) include all the custom properties for a component shape, but you can create a custom report definition that includes only the shapes you want to list and the criteria you want to use.
The Report Definition Wizard isn't designed to accommodate the modeling behavior of process engineering diagrams. Therefore, it reports on shapes, not components. The built-in report definitions filter out duplicate shapes so that each component's data is reported only once. However, if you create your own report definition, make sure you also filter out duplicate shapes.
Follow these steps to create a custom report definition that filters out duplicate process engineering shapes, so that you only get the information for each component once:
- Choose Tools, Report. If you want to base the new report definition on an existing definition, select the existing definition in the Report dialog box.
- Click New, and then choose the option for the shapes on which you want to report.
- Click Limit Selection to define the criteria for the report. In the Limit Selection dialog box select PEComponentTag from the Property list, Select Exists in the Condition list, and Select TRUE in the Value list.
- Click Add to put this condition in the defined criteria list, and then click OK.
- Click Next in the Report Definition Wizard.
- Check <Displayed Text> to report on the component tag. Check any other properties you want to report on, and then click Next.
- Click Subtotals. In the Subtotals dialog box select <Displayed Text> in the Group By list, and then click Options. Select the Don't Repeat Identical Values option, and then click OK to close each dialog box until you return to the wizard.
- Click Next, complete the information to save your report, and click Finish. Then click OK to save your definition, which is added to the list of report definitions.
For details about the options in each screen of the Report Definition Wizard, see "Defining a Custom Report."
EAN: 2147483647
Pages: 211