MSPP Performance Management
| Why care about monitoring the performance of services? Services, especially voice and video, are impacted when performance degrades to a certain level. For example, the quality of voice calls might begin to degrade or the voice call might even drop. Digital video transmission might have pictures that are distorted or even frozen. This is unacceptable in a service-provider environment, especially when SLAs have been set up with customers. Not meeting the service level specified in this agreement can cause monetary damages. A Threshold Crossing Alert (TCA) is a key component of performance management. You use TCAs to detect early performance degradation on the services that the ONS 15454 provides. These services include Ethernet, storage, optical, electrical, and DWDM services. The ONS 15454 uses thresholds to set error levels for performance-monitoring (PM) parameters. The ONS 15454 accumulates the counters that keep track of each PM parameter. For example, one PM parameter is the DS3 line code violations, DS3 CV-L, which indicates the number of coding violations occurring on the DS3 line. In this case, the error level is defined in CTC to determine how many DS3 line code violations need to occur before a TCA is issued. Each PM parameter's TCA value needs to be set up in CTC. When the threshold is triggered, the ONS 15454 sends out the TCA as an SNMP trap and TL1 message. In addition, the TCA is displayed in CTC. Note ONS 15454 contains a default value for every PM parameter in the ONS 15454. You must change the threshold if the default value does not satisfy your requirements. For example, each service provider has its own set of service-level requirement to meet the SLA established with its customers. You might have to lower the default thresholds to have a high QoS on the line. The SNMP trap name is performanceMonitorThresholdCrossingAlert. The SNMP trap contains all the details associated with a TCA displayed in CTC. In addition to the normal SNMP trap information (slot, port, and so on), the details associated with a TCA are added in the trap message:
Ethernet Performance MonitoringMonitoring Ethernet traffic is similar to monitoring optical, electrical, and DWDM traffic. You also establish thresholds for performance parameters being monitored for Ethernet. Ethernet traffic has its own set of performance parameters that thresholds can be established for. These performance parameters are defined in MIB-II and the Remote Network Monitoring (RMON) MIB. What Is RMON?RMON enables you to monitor Ethernet traffic on an ONS 15454 network. You can use RMON to view the Ethernet traffic flow in the network to assist in proactively monitoring the service. RMON is an MIB that defines a group of Ethernet performance statistics. Monitoring software can gather these standard sets to allow the organization to keep track of the health of the network. These Ethernet statistics can be used not only to provide performance monitoring, but also to analyze the network utilization for capacity planning and troubleshooting reasons. The RMON MIB contains different groups. A vendor can implement one or more of these groups on its communications equipment. These RMON groups are supported on the ONS 15454:
Note The ONS 15454 supports the High-Capacity Remote Monitoring Information Base (HC-RMON MIB). The HC-RMON MIB enables 64-bit statistics for the etherStatsHigh CapacityTable and the EtherHistoryHighCapacityTable. The etherStatsHighCapacityTable is an extension of the etherStatsTable that adds 16 new columns for performance-monitoring data in a 64-bit format. For example, the Cisco 15454 supports the alarm group. The alarm group is one section of the MIB that contains a table. This alarm table contains a list of alarm thresholds that can be configured to program the 15454 to send an alarm message when this threshold is reached in a 15-minute interval or in a 24-hour interval, for example. This interval is a configurable parameter and can be specified as small as 15 seconds. As an example, you can configure the alarm group to send out a trap if the number of incoming octets (ifInOctets) for an interface is more than 8000 over a period of 15 seconds. The RMON MIB also controls the sampling of Ethernet metrics. The sampling period can be 1 minute, 15 minutes, 1 hour, or 1 day. The RMON MIB stores this information in a table, called the etherHistoryTable, which OSS applications can retrieve. This information is stored in the table on a perEthernet interface basis. For example, if the number of Ethernet frames is being counted every 15 minutes on the first port of a G1K card in slot 1, these samples are stored in the table and associated with Port 1 in Slot 1. In another scenario, you might want to set the sampling period to 1 and stop sampling at 60. In this case, the RMON MIB creates 60 entries in the table. Creating a Threshold in RMONTwo threshold values must be specified when creating a RMON threshold: the rising threshold and the falling threshold. Other parameters must be configured as well:
The ONS 15454 sends an RMON TCA every time a threshold is reached. This alarm is displayed as rmonThresholdCrossingAlarm in CTC. Figure 14-15 shows SNMP traps being sent when rising and falling thresholds are reached. Figure 14-15. Rising and Falling Thresholds in RMON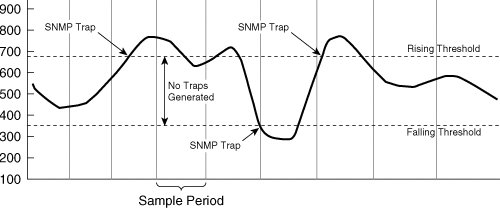 The ML Series cards have additional RMON capabilities, compared to the Layer 1 Ethernet cards. You can set up a customized threshold-crossing trap by configuring the RMON MIB to monitor an object in any other MIB used in the ONS 15454. This must be accomplished in Cisco IOS. When triggered, the ONS 15454 generates an SNMP trap to all defined trap destinations. For example, perhaps you want to monitor the interface errors on Port 1 on the ML 1000 card in Slot 1. The first step is to set up the alarm in RMON. The following command is issued in IOS:
This IOS command configures RMON to monitor ifEntry.14.1 once every 200 seconds. If the ifEntry.14.1 value shows a MIB counter increase of 500 or more, the alarm is triggered. As a result, this alarm triggers event number 10, which is configured with the rmon event command as follows: # rmon event 10 log trap communityStrdescription "High If Errors" owner config This event generates a trap called High If Errors and logs the event in a table. Using the RMON to Monitor Ethernet PerformanceYou can use the RMON MIB to monitor the 15454 Ethernet cards that are discussed in Chapter 7, "ONS 15454 Ethernet Applications and Provisioning":
In addition to the Ethernet cards, you can use the RMON MIB on other ONS 15454 cards, such as the Fibre Channel (FC) card and many of the DWDM Transponder-based cards. Note RMON must be set up in the ML 100 and ML 1000 by using IOS commands. Note that the ML 100 and ML 1000 cards have SNMP agents. The ONS 15454 forwards SNMP requests messages to the ML cards through a proxy agent and uses the slot identification of the ML cards contained in the SNMP message to distinguish the request from the ONS 15454 SNMP request. Figure 14-16 shows the table used in CTC to define RMON thresholds. Figure 14-16. RMON Configuration Table in CTC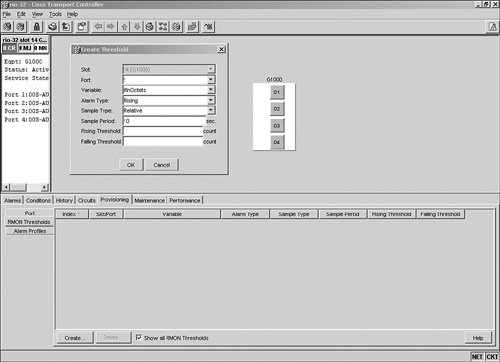 Multipoint Ethernet MonitoringLayer 1 Ethernet refers to point-to-point Ethernet service using the G1K or CE 10/100 cards. As discussed in the previous section, RMON can be used to monitor these cards. The parameters that are monitored correspond to different Ethernet statistics, such as the number of Ethernet frames received on a port. You can also monitor performance on other variables, such as QoS. QoS is considered Layer 2 information and can be used on Multipoint Ethernet service using the ONS 15454 ML 100 and ML 1000 cards. For example, you might want to monitor per-CoS packet statistics on the ML Series card interfaces when CoS accounting is activated. In other words, a network operations center (NOC) might want to monitor the number of Ethernet frames carrying voice packets on an interface. Monitoring the number of frames with a CoS value of 5 (this assumes that this is the CoS assigned to voice traffic) enables the ONS 15454 to keep track of the amount of Ethernet traffic on a per-service basis. CoS-based traffic utilization is available on a per-port or per-VLAN basis. IOS commands (native language of ML Ethernet cards) or SNMP can be used to gather this information. |
EAN: 2147483647
Pages: 140