5.3 Detailing the Use Cases
| So far, we've identified what a use case is: a named system operational capability. We've also noted that use cases organize functional and quality of service requirements. However, a name alone isn't enough to understand what a use case means. For example, consider the use case Set Ventilator Tidal Volume[7] the user turns a knob and sets the amount of mixed breathing gas pumped out per breath for the ventilator. That's not enough detail to understand how it actually works. For example:
In requirements analysis, the devil is in the details and answering these questions is crucial. The process of identifying the dozens or perhaps hundreds of detailed, specific requirements is known as "detailing the use case" in the ROPES process. Two categories of approaches are possible. A specification can be written for the requirements. This specification can be either informal (text) or formal using a formal or semi-formal language such as statecharts or activity diagrams. The other approach is to provide examples of operational usage. Remember that in Section 5.1, we identified three kinds of requirements. Functional requirements are best captured in specifications. Operational requirements are best captured in scenarios or activity diagram workflows. QoS requirements are added to both representations as modifiers of the primary requirements. It should be noted that functional requirements can be defined in scenarios just as operational requirements can be defined in specifications. However, the general rule is that functional requirements are most often captured in specifications and operational requirements are most often captured in scenarios. 5.3.1 Scenarios for Use CasesA scenario is a particular actor-system interaction corresponding to a use case it is a specific example of a use case execution in the system's operational environment. Scenarios model order-dependent message sequences among object roles collaborating to produce system behavior in its operational environment. Different scenarios within a given use case show permutations of object interactions. Even early in analysis, the advantage of scenarios is that domain experts and users can usually quite easily walk the analyst through dozens of typical system usage scenarios. The domain expert can explain why each step is taken, who initiates it, what the appropriate responses are, and what kinds of things can go awry. In going through this process, the analyst will uncover many important facets of the system behavior not mentioned within the problem statement. Scenarios provide an invaluable tool for validating the problem statement against the user's expectations as well as uncovering the less obvious requirements. Late in analysis, they can be used to test the object structure by ensuring the appropriate participation by each object in each scenario. Generally, a medium-sized system will have a few to a few dozen use cases. Each use case will have anywhere from a few to a few dozen scenarios of interest. There are an infinite set of scenarios, but it is only necessary to capture the ones that are interestingly different that is, the ones that capture operational, functional, or QoS requirements, including exceptions and error identification, isolation and recovery, as appropriate. The scenario set is said to be complete when all of the operational requirements are covered in at least one scenario. This, of course, is a small subset of all possible scenarios. Some use cases have a "sunny day" or primary scenario. In this case, most or all of the other scenarios for the use case are variants on the primary scenario. Every scenario has an underlying structural context. This structural context is the set of object roles that may appear in the interactions. Early in analysis, the structural context is the use case diagram; the objects available for scenarios are the system (or the use case, which isn't an object, but is a classifier and may be used for a lifeline in a sequence diagram) and the actors identified on use case diagram. The structural context is shown on the use case diagram, but if desired, a Context Diagram (i.e., a class diagram with the actors and the system) can be drawn. In most cases, I have found the system use case diagram sufficient for this purpose. Use cases are realized by collaborations of objects inside the system working together. Later analysis decomposes the system into such objects, and the use case scenarios can be refined by adding these additional levels of detail. It is important that you only use objects in the scenario that appear in the structural context. That means that if the use case diagram has two actors and the system, only three objects can appear in the scenario. Later, once the system is opened up and is under design, internal objects are identified. At that time, these internal objects may then appear in the scenarios as well, but to do so too early is a common and fundamental mistake in requirements analysis. Requirements should be as free of design as is possible. This means not mixing in design elements too early that is, the purpose of the identification of the structural context for the scenario. It is crucial to make sure you always know the structural context. Otherwise, you'll be making stuff up on the fly with only a vague notion as to the underlying structural model. If you have a number of people doing this, the chances the models will all play together later is vanishingly small because each designer will be making up different (and incompatible) pieces. At the end, the system requirements will be specified in terms of mutually incompatible design decisions and must be thrown away and redone. By drawing and agreeing on the structural context before beginning the scenario analysis, the scenarios from use cases elaborated by different analysts will all play together when it comes time to decompose or implement the model. It is important to stress that building and analyzing scenarios is a creative process of discovery. It is not simply a matter of starting with postulates and applying mathematical deduction to derive all possible behavior paths. Deep within the crevices of the domain experts' minds are hidden requirements that may never be explicitly identified.[8] These cannot be deduced from the problem statement per se. The process of scenario modeling brings these hidden requirements to the surface so they can be added to the system features.
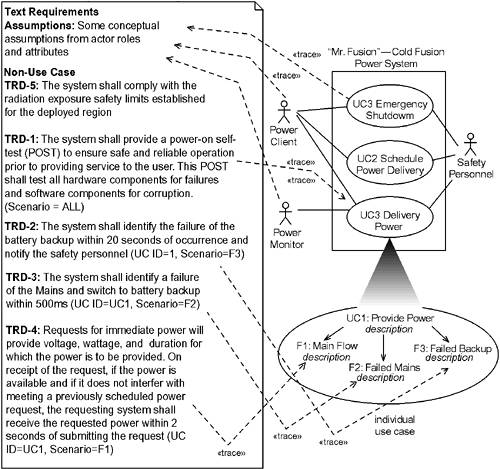
Three primary scenario representations exist within the UML: sequence, communication (formerly collaboration), and timing diagrams. Sequence diagrams, the most commonly used, emphasize messages and their sequence. Communication diagrams are less popular and tend to stress the system object structure. Timing diagrams are best applied when the requirements are highly time-sensitive. All of these diagram types show scenarios but differ in what they emphasize. Almost exclusively, in use case analysis, sequence diagrams are preferred over communication diagrams. Communication diagrams are not used until the object model of the system stabilizes (and even then, many people prefer sequence diagrams anyway). Timing diagrams are less applied, but are useful when timing is crucial. In this chapter, we will primarily focus on sequence diagrams. 5.3.1.1 Sequence Diagrams for Requirements CaptureSequence diagrams represent scenarios. A scenario is a specific interaction of object roles consisting of a potentially large number of scenario steps. Each scenario step may be a message, stimulus, event reception, or action. In requirements analysis, scenarios are used to capture operational requirements; that is, requirements around the interaction of the system with its environment. This means that the operational requirements include not only the specification of the services provided by the object roles, but also the allowed and disallowed sequences of those services and their QoS requirements. Most development organizations have a history of using textual specifications for capturing requirements. Even after adopting the UML, many organizations continue using text as an adjunct to scenarios and statecharts to capture requirements in a more formal way. Figure 5-20 illustrates the trace relationships between textual requirements and use cases and their scenarios. If the requirements are captured entirely, or mostly, in the UML model, then internal «trace» stereotyped dependency relations can provide traceability inside the model. If extensive external textual documents are used, then requirements traceability tools can provide the link to navigate between model elements and the requirements that they represent or realize. Figure 5-20. Relating Text and Scenarios
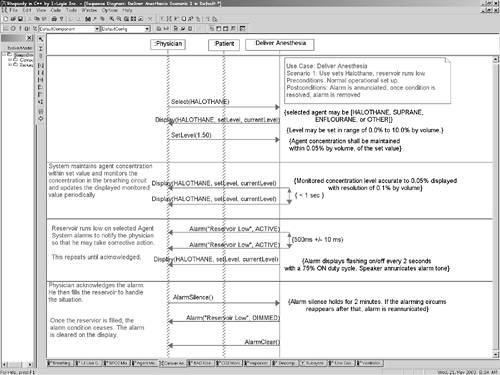
An example sequence diagram from the anesthesia machine is shown in Figure 5-21. This diagram has several aspects worthy of note. First, the diagram has a descriptive note in the upper right corner that names the sequence diagram (not required if you're using the sd operator for UML 2.0 sequence diagrams), a brief description, and the preconditions and postconditions. While every use case has pre- and postconditions, use case sequence diagrams usually have a more constrained set of them and it is useful to specify it. In this sequence diagram, the use case is used as a lifeline rather than the system. The appropriate interpretation for this lifeline is "the system executing the use case." If you prefer the System object instead, that is equivalent. Figure 5-21. Use Case Sequence Diagram
The sequence diagram shows one particular path through the execution of the use case, that is, it represents one of many scenarios. This scenario was captured because it was both a reasonable use of the system and because it showed an important operational interaction of the system, as specified by the sequence of message exchanges. In addition, note the use of constraints to add functional and QoS specifications, such as the allowed set of anesthetic agents, the allowable settings for concentration of these agents, and the accuracy of the delivery of the drugs with respect to those settings. Of course, to capture the operational (and other) requirements of the Deliver Anesthesia use case, several dozen scenarios would be provided, using different drugs, concentrations, and operational sequences. A non-trivial number of these would capture the exceptional scenarios the scenarios that involve something going wrong, such as system misuse, failures, errors, or unexpected events. The scenario in Figure 5-21 gives an example of what might happen if the drug reservoir runs low the system triggers an alarm, and the physician silences the alarm and adds more drugs to the reservoir. Other scenarios might detail the operational sequences when the system can't maintain the proper drug concentration, there is a failure in one or more of the gas supplies, the ventilator (shaping the breaths) fails, there is a breathing circuit disconnection, there is a kink in the gas delivery line to the patient, the agent monitor reports an internal failure, the delivered agent is different than the commanded agent, and so on. As we've seen, it is important to only use elements on the sequence diagram that appear in the problem context. At the systems level for the anesthesia machine, that means that only the system actors (e.g., the Patient or Physician) and either the System or the relevant use case. What about moving forward into the subsystem architecture or even the semantic object model? How do we know that we've done a good job of the subsystem architecture or specifying the semantic objects of the system? Remember that we've captured the requirements at least in part in sequence diagrams. Therefore a measure of goodness of the architecture or object model is that the design (at the level of abstraction being considered) can realize the operational scenarios defined at the system level. If it can realize all of the scenarios defined at the system level, then the architecture or object model is good and if not, then it is inadequate. To demonstrate this is true, we elaborate the scenarios by adding the level of detail from the architecture or the object model and then we execute the system to demonstrate that the elaborated scenario executes properties. Consider the object model in Figure 5-22. This shows three subsystems working together to realize the Deliver Anesthesia use case, with the internal structure of the Vaporizer subsystem detailed (with respect to this collaboration it may well contain other elements not used in this collaboration). A very relevant question to ask of this collaboration is "Is this good?" That is the same as asking, "Does this collaboration meet its requirements?" Figure 5-22. Deliver Anesthesia Collaboration
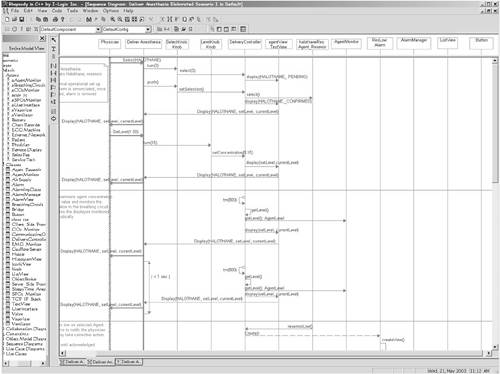
To find out, we can elaborate the system-level scenario in Figure 5-21 with these semantic elements to see. The elaboration is shown in Figures 5-23 and 5-24. The lifeline elements for the semantic objects are taken from the class diagram shown in Figure 5-22 and are added to the elements shown on the original sequence diagram. To highlight the original elements, the arrows from the original scenario are made with heavier lines. Figure 5-23. Elaborated Scenario Part 1
Figure 5-24. Elaborated Scenario Part 2
As a matter of personal preference, when I elaborate scenarios in this way, I like to leave the original scenario exactly the same and add the more detailed elements to it. This greatly facilitates tracing the elaborated scenario back to the original system scenario and helps ensure that the elaborated scenario is in fact an elaboration of the original. If elements are removed in the elaboration, then demonstrating the equivalence is much more difficult. Thus the elaborated scenario shows the use case from the original as the mediator of messages into the system. Because some developers find this odd, they prefer to use the System object there instead, which is equivalent. The point is to demonstrate that the design elements of the system collaborate together to realize the set of scenarios used to capture the requirements for the system. In UML 2.0, this elaboration can be done by decomposing the Use Case or System lifeline, representing its internal structure on a separate (referenced) sequence diagram. The primary advantages of this approach are that it keeps the original sequence diagram the same and scales up to possibly many levels of decomposition as the system design progresses. The disadvantage is that the more detailed interaction cannot be seen on a single diagram. 5.3.1.2 Capturing QoS Requirements on Sequence DiagramsThe single most differentiating characteristic of real-time systems is their concern and treatment of time, as discussed in the previous chapters. In the realm of real-time systems, defining the external timeliness requirements is crucial to understanding the problem. However, most timing requirements are derived rather than primary requirements. That is, a specific timing constraint may arise from a need for accuracy or fault tolerance. Because these requirements are derived, it is all too common for them to be missed by systems designers, leading to unstable system performance. Thus, it is vital that these time constraints be captured as part of the system model so that they can be treated appropriately. A number of time values can be captured. Those time values that are QoS requirements can be captured as constraints applied against the actions or messages. Those time values that are estimates, used for the purpose of analysis, can be captured as tagged values (user-added properties of model elements). Tagged values are shown as { property = value} pairs in constraints. A number of parameters are required to specify the timing requirements for real-time systems. Naturally, incoming messages must have their timing characterized. If they are periodic, then their periods and jitter must be identified. If they are aperiodic, then appropriate values, such as their minimum interarrival times and averages rate, must be defined. The system response timing is commonly defined in terms of deadlines. If the response has a hard deadline, then missing the deadline constitutes a systems failure. In a soft deadline response, the response performance must be stochastically specified. Soft systems are permitted to lag in their response but are expected to maintain an average throughput or system response. Firm deadlines have both a hard deadline as well as an average throughput requirement. Response performance may be further specified into a worst-case hard deadline and an average response time when appropriate. Some performance requirements must be met only in the long run, and occasionally missing a deadline creates no difficulties. These soft deadlines may be defined as average response time requirements or a bounded mean lateness. Firm deadlines have both a hard deadline and a shorter average response time. More complex timing behavior requires more complex modeling, as noted in Chapter 4. In some cases, scalars cannot adequately specify the timing of behavioral responses. Many actions require relatively long periods of time to perform and intermediate responses may be important. For example, an emergency shutdown of a nuclear reactor is implemented by insertion of control rods into the core. This may be initiated by an event such as a coolant leak or an explosive temperature and pressure buildup. This takes time. To avert an incident, it is preferable to insert the rods 90% of the way as soon as possible even if the remaining 10% takes much longer. Control loops are another example. Quick, if incomplete, responses stabilize PID control loops, even if the system response asymptotically converges much later. These issues are domain- and system-specific. For many situations, the only concerns are service time and latency. Modeling 50% or 80% response times may be important in some special applications. In other applications, several points from a stimulus-response curve may be required to adequately characterize the performance requirements. In most real-time systems, the time-response requirements are crucial because they define a performance budget for the system. As objects and classes are defined, this performance budget propagates through the analysis and design phases. Ultimately, they define a performance (sub)budget for each and every operation and function call in the thread of execution responding to the event. The sum of the (sub)budgets must meet the specified overall system performance requirement. For example, a message and the completion of its reaction may have a hard deadline at 500 ms. The overall response may be implemented via a chain of six operations. Each of these operations must be allocated some portion of the overall performance budget. 5.3.2 StatechartsStatecharts are a formal behavioral language that lends itself to the specification of use case behavior. The use case formal language has a number of advantages over text:
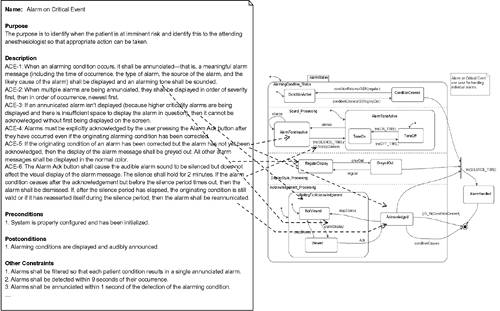
The primary disadvantage of using statecharts is that because they are a precise formal language, most customers and marketers will not understand them and will not be able to assist directly in validation or verification. However, this limitation can be addressed very easily by generating scenarios traversing the various paths in the statechart. Customers and marketers can understand scenarios very easily. I have found it very useful to generate both statecharts and sets of sequence (or timing) diagrams that traverse the statecharts. This topic will be discussed later in this section. The semantics and syntax of statecharts was described in some detail in Chapter 3. We will concern ourselves here with their application in the capture and analysis of requirements. Statecharts are particularly effective when the use case is reactive; that is, it has inherent states (conditions) and remains in those conditions until an event of interest has occurred. Events and messages from the actors are modeled as events in the statechart while messages to the actors are modeled as actions on the state machine. Consider the requirements for the Alarm On Critical Event, shown in Figure 5-25. We see a relatively small number of requirements, but they are still nonetheless nontrivial to understand. One can envision a number of scenarios traversing different paths through that textual specification, some with the alarm ceasing before the acknowledgment, some after, and some never ceasing. A statechart shows the interaction of the requirements more clearly, as shown in Figure 5-26. Figure 5-25. Alarm On Critical Event Requirements
Figure 5-26. Alarm On Critical Event Statechart
The and-states show the independent aspects of the processing of the incoming events the silence, the acknowledgement semantics, the display, and the sounding of the tone. The GEN() operation generates events that are consumed by the other and-states. For example, when the use case is in the state AlarmToneInactive (because the alarm silence button was pressed), and the silence time elapses, then a stopSilence event is produced which is consumed by each active and-state that needs it.[9]
Statecharts can be related to the text in a straightforward fashion, as was shown with sequence diagrams. Figure 5-27 uses trace dependencies to show where the alarming requirements are represented in the statechart. Figure 5-27. Statecharts and Text
As mentioned previously, statecharts can be related to scenarios as well. Different operational scenarios take different paths through the statechart, allowing us to easily relate to two notational forms. How many scenarios are represented by the statechart in Figure 5-26? The answer is infinitely many not only do we have loops (and one time through a loop is different than 10 times through the loop), we also have concurrent and-state regions in which the relative processes of each with respect to each other is not defined. Figure 5-28 shows one such path through the statechart, but we can see that there are very many more. In this scenario, the ECG machine actor detects that the patient goes into asystole (i.e., the patient's heart stops beating). The system then prints an alarm message to the Chart Recorder and begins annunciating the tone. Simultaneously (hence the use of the par or parallel operator in the sequence diagram), the display accepts the scrollDown() message from the physician and scrolls the alarm into view. Now the alarm is in the Viewed state. The alarm continues to sound until the physician sends the silence() message (mostly likely by pressing a button dedicated for that purpose). Now the alarms are silenced and the alarm display is grayed out. The physician gets the patient's heart to beat (perhaps he shows him the bill), and the ECG machine detects that the alarm condition has ceased and sends a message to that effect to the system. The system responds as specified by the use case statechart, transitioning to the AlarmHandled state. Figure 5-28. Statecharts and Sequence Diagrams
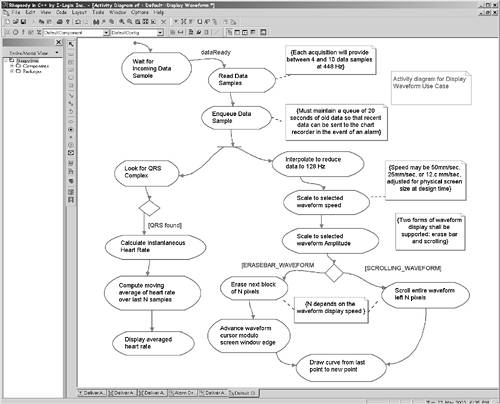
5.3.3 Activity DiagramsIn UML 1.x, activity diagrams are isomorphic with statecharts. In UML 2.0 they are a superset, since their semantic basis is now token flow semantics, which represent Turing machines. However, the most common use of activity diagrams in the development of real-time and embedded systems will still most likely be in their use as concurrent flowcharts. Activity diagrams are most commonly used when a behavior can be specified as a set of control flows with operators (sequence, alternative, loop, fork, and join), and progress is made primarily on the completion of actions rather than waiting in a state until an external event is received. That is, activity diagrams are most commonly used to represent algorithms that, once initiated, proceed inexorably to their conclusion. Statecharts can represent algorithms as well by using null-triggered (anonymous) events connecting states although their most common use is with explicit triggering events. For example, consider the control algorithm for processing incoming waveforms shown in Figure 5-29. This activity diagram includes the acquisition of the waveform data from the ECG acquisition module. The first transition, in fact, is triggered by an incoming event from that module, perhaps implemented as an interrupt, indicating that some data samples are ready (probably somewhere between two and 10, depending on a number of factors). The subsequent processing proceeds from activity to activity as the actions within the activities complete. After the data is enqueued, two independent processing threads (these are logical threads and do not necessarily imply OS threads or tasks) proceed independently. One of them scans the data stream for evidence of a QRS complex indicating a ventricular contraction (heartbeat), and if found, uses this information to calculate the instantaneous heart rate (the reciprocal of the time between this and the last beat). Since individual heartbeats vary based on many factors such as pressure on the chest, the presence of an inspiration or expiration, blood gas concentration, and so on the physician is actually interested in the average heart rate, so a moving average filter is applied to reduce the high-frequency variance artifacts in the heart rate. The second logical thread performs a data reduction because it is typically sampled four times or more faster than it needs to be for display purposes. The physician scales the waveform display in time (displaying the waveform at 50 mm/sec, 25 mm/sec, or 12.5 mm/sec) and in amplitude to adjust for variances in electrode placement, subcutaneous adipose tissue, and other factors. Finally, a curve is drawn from the last displayed point to the new point to display. Figure 5-29. Display Waveform Activity Diagram
The physician can select either of two waveform display styles. The first, called the erase bar style, advances a cursor with each new displayed data point and erases the area from the last data point to the cursor (as it is currently displaying old data there) and then draws the new data as a curve from the old data point to the new. The cursor advancement is done modulo the screen edge so that when the cursor advances past the right edge of the screen, the cursor snaps to the left edge of the screen. The other style is called scrolling waveforms and is often done with hardware support. While in the first form the position of new data changes constantly, with scrolling waveforms new data always appears at the right edge of the waveform window. When the next data is ready to be displayed, the old data is scrolled left (data at the left edge of the window being discarded) and the new data is drawn. The qualities of service required for this algorithm are provided in constraints in the figure. 5.3.4 Timing DiagramsSimilar in some ways to sequence diagrams, timing diagrams also represent scenarios. The essential difference between sequence and timing diagrams is that the latter emphasize change in value or state over time while the former emphasize sequences of message exchange. They are, approximately at least, isomorphic and able to represent the same information, but their purpose is different. Sequence diagrams used in requirements analysis focus primarily on the sequences of messages in operational scenarios. Timing diagrams focus on the qualities of service having to do with time, such as execution time, jitter, deadlines, periodicity, and so on, and how they affect the state of the system (or, more precisely, of the use case) or an important value held by the system. Use cases, being classifiers, can have operations and attributes. The use case operations will be realized by services offered by the system to actors in its environment. Attributes will ultimately be realized by object (or attributes of objects) held within the system. Use case behavior can also be specified by statecharts and activity diagrams. In requirements analysis, timing diagrams are best applied to use cases when there are significant timeliness qualities of service of either some attribute or the state of the use case. It is important to remember that timing diagrams show scenarios with an emphasis on their time properties. Scenarios represent very particular runs of the system, and different runs of the system may result in different timing. For example, suppose in one case an event comes in at t0+20ms[10]; the next time the scenario is run, the event might occur at t0+22ms. Is one of them wrong? No, but they may differ. To specify the timing requirement, you will use a constraint such as { t = t0 + 21 ms +/- 2 ms } . This can be done using the RT profile properties as well, if desired, as described in Chapter 4, but this requires a level of expertise that most customers may not possess.
The activity diagram from Figure 5-29 is used as the basis for the scenario, shown in Figure 5-30. The comment box in the upper right corner gives the preconditions for the particular scenario (waveform display speed is 25 mm/sec and the erase bar waveform style is used). The scenario then shows the change of state (activity state in this case) as processing progresses from the dataReady event until processing is complete. Since this is a scenario, the durations spent in the various activities are not specifications but examples. In several places, timing specifications are given using constraints. Figure 5-30. Use Case Timing Diagram
|
EAN: 2147483647
Pages: 127