Packet Analyzers
| Packet analyzers are software or hardware devices that capture and analyze the data flowing through the network. Packet analyzers are also called sniffers, protocol analyzers, and network analyzers. The term sniffer became popular after the release of the commercial product Sniffer Pro. Many packet analyzers provide capabilities to filter, store, and analyze the captured data. In fact, most network intrusion detection systems (NIDS) are packet analyzers that watch for peculiar traffic patterns that are unique to network attacks. Packet analyzers work at Layers 1 and 2 of the OSI model but can also decode data at higher layers. This feature enables networking professionals to have a cross-sectional view of the data flowing through the network in real time. The ability to slice and view the raw data flowing through the wires is important when troubleshooting. Such views also help networking professionals to learn and understand the functioning of various protocols and applications. The views also provide clear proof that the network and its components are operational. Network auditing using packet analyzers is a two-step process, as follows:
Preparing the NetworkPacket analyzers function by capturing and analyzing all the data flowing through the wire. Packet analyzers can capture the data through one of the following techniques:
Cisco Catalyst switches offer the port-mirroring function, which allows all the traffic flowing through a source port to be broadcast to a mirrored port. The process is transparent to the devices that are connected to the source port. However, the mirrored port receives an exact copy of the data flowing through the source port. By connecting the packet analyzer to the mirrored port, all packets flowing through the source port are available for sniffing. Port mirroring, also called port monitoring, is referred to as Switched Port Analyzer (SPAN) by Cisco. In addition to the ability to mirror a single source port, Cisco SPAN also allows mirroring of groups of ports or even an entire VLAN. For more information on the limitations and additional SPAN features available on a particular model of Catalyst switch, refer to the product documentation section of the Cisco website (cisco.com). To configure SPAN on a Cisco Catalyst switch, you should specify the source port, the destination port, and the direction of the traffic through the source that you want to mirror to the destination port. Moreover, you need to physically connect the packet analyzer to the destination SPAN port to enable the packet analyzer to receive the traffic. The following two sections cover the details involved in configuring SPAN ports on both CatOS- and IOS-based Cisco Catalyst switches. SPAN for CatOS SwitchesTo configure a SPAN port on CatOS-based switches, perform the privileged-mode-command specified in Table 7-3.
Example 7-10 shows how to configure SPAN so that both transmit traffic and receive traffic from port 1/1 (the SPAN source) are mirrored on port 2/1 (the SPAN destination). Example 7-10. SPAN Configuration CatOS Console> (enable) set span 1/1 2/1 Destination : Port 2/1 Admin Source : Port 1/1 Oper Source : Port 1/1 Direction : transmit/receive Incoming Packets: disabled Learning : enabled Multicast : enabled Filter : - SPAN for IOS SwitchesTo configure a local SPAN session for IOS-based Catalyst switches, use the global-configuration-mode commands listed in Table 7-4.
Example 7-11 shows how to configure SPAN session 1 so that both transmit traffic and receive traffic from port 5/1 (the SPAN source) are mirrored on port 5/48 (the SPAN destination). Example 7-11. SPAN Configuration IOSRouter(config)# monitor session 1 source interface fastethernet 5/1 Router(config)# monitor session 1 destination interface fastethernet 5/48 Using Packet AnalyzersThe open source community enjoys a rich choice of versatile packet analyzers that range from general-purpose network analyzers, such as Tcpdump, to specialized password sniffers, like Dsniff. Table 7-5 provides a list of popular packet analyzers and their functions.
Both Tcpdump and Ethereal are powerful tools capable of sniffing and analyzing network traffic. Both packet analyzers are under active development and enjoy communitywide support. The following sections cover these tools in more detail. TcpdumpTcpdump is a general-purpose network analyzer capable of capturing and displaying network packets. Tcpdump prints the headers of packets on a network interface, provided that the packet matches the filtering criteria. Tcpdump requires root privileges to run in promiscuous mode and to function correctly. In promiscuous mode, the network interface card (NIC) captures every packet flowing through the wire, even if the packet is destined for other addresses. The syntax for running Tcpdump is as follows: tcpdump [options] [filter] Tcpdump is command-line based, making it ideal for remote use. Netadmins can quickly analyze network anomalies by looking at the raw data captured and filtered by Tcpdump. Tcpdump's greatest strength, its powerful command-line interface, also makes it difficult to work with. The online manual (which can be opened by using the man tcpdump command in Linux) is well written, but it can be overwhelming for new users. However, when mastered, Tcpdump is a great asset in a Netadmin's tool kit. Tcpdump options can be classified into the following three categories:
Table 7-6 provides a list of common options for controlling the input behavior of Tcpdump.
By default, Tcpdump output is displayed on the console. Even in a small network, the output can be large and, thus difficult to read on the screen. Table 7-7 provides a list of options for controlling Tcpdump output.
The real strength of Tcpdump lies in its highly flexible filters. These filters can be applied through the command line or using a text file. The text file should include each filter as a separate line. Table 7-8 lists common keywords for Tcpdump filters.
Understanding Tcpdump OutputBecause it is a CLI-based tool, Tcpdump lacks the advantage of easy-to-read GUI-based output. Nonetheless, Tcpdump developers have done a great job simplifying the display output. Example 7-12 shows the Tcpdump output. Without the c option, Tcpdump continues to capture packets until the user presses Ctrl-C. After stopping, Tcpdump displays a summary of the packets captured, filtered, and dropped by the kernel. Example 7-12. tcpdump Outputroot@ttyp1[knoppix]# tcpdump tcpdump: verbose output suppressed, use -v or -vv for full protocol decode listening on eth0, link-type EN10MB (Ethernet), capture size 96 bytes . . . # output suppressed for clarity 09:40:31.114308 IP 192.168.0.10.www > 192.168.0.101.55411: S 2675891891:2675891891(0) ack 1652868034 win 4128 <mss 1460> 09:40:31.114362 IP 192.168.0.101.55411 > 192.168.0.10.www: . ack 1 win 5840 09:40:31.114464 IP 192.168.0.101.55411 > 192.168.0.10.www: P 1:426(425) ack 1 win 5840 09:40:31.221797 IP 192.168.0.10.www > 192.168.0.101.55411: . 1:561(560) ack 426 win 3703 55 packets captured 55 packets received by filter 0 packets dropped by kernel Consider the first packet captured in Example 7-12. Figure 7-9 provides an explanation of each field. While comparing the first line of the output in Example 7-12 to the subsequent line, notice an interesting property of Tcpdump. During the initial TCP handshake, Tcpdump displays the entire sequence number. After the TCP connection is established, Tcpdump converts the absolute sequence numbers to relative sequence numbers for ease in tracking the TCP conversation. Figure 7-9. Explanation of Tcpdump Output Fields Tcpdump ExamplesTable 7-9 shows a list of common examples that illustrate the use of Tcpdump.
Tcpdump can be used for the following tasks:
Tip Cisco PIX Firewall version 6.2 and higher offers a packet capture feature similar to Tcpdump. Although limited in functionality, this feature can be handy when troubleshooting firewall issues. EtherealEthereal is a commercial-grade network analyzer with built-in support for more than 680 protocols. Ethereal is similar to Tcpdump but provides the following advantages:
Ethereal should be started with root privileges to enable the network interface in promiscuous mode. To start Ethereal with root privileges in Knoppix CD, click K Menu > Internet > Ethereal (as root). As shown in Figure 7-10, the Ethereal window is split into three panes. The top pane lists all the packets, and the middle pane provides the details of the packet selected in the upper pane. The bottom pane displays the byte-level data contained in the selected packet. Figure 7-10. Ethereal Window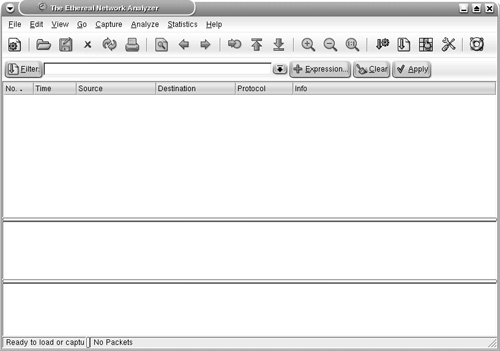 Note When starting some applications, including Ethereal, the Knoppix CD might prompt you for a root password. As a security measure, Knoppix does not distribute the preset password for root and instead provides a manual way to reset the password. To set the root password in Knoppix, follow these steps:
The steps involved in using Ethereal are as follows:
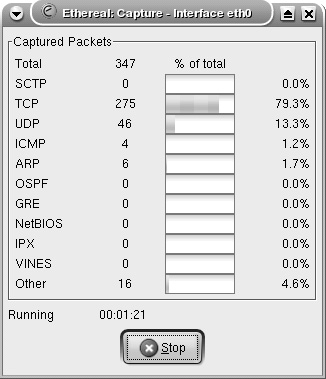
Starting a Capture Session to Collect PacketsTo start capturing packets, choose Capture > Start from the Ethereal toolbar. The Capture Options window (see Figure 7-11) provides various options that are self-explanatory. The Capture Filter options can be used to specify the filters before adding data to the buffer. The Stop Capture section provides a means to limit the amount of packets captured by count, size, or time. To begin capturing data, click the OK button in the Capture Options window. The Capture window, which shows a summary of captured packets, is displayed. Figure 7-11. Ethereal Capture Options Window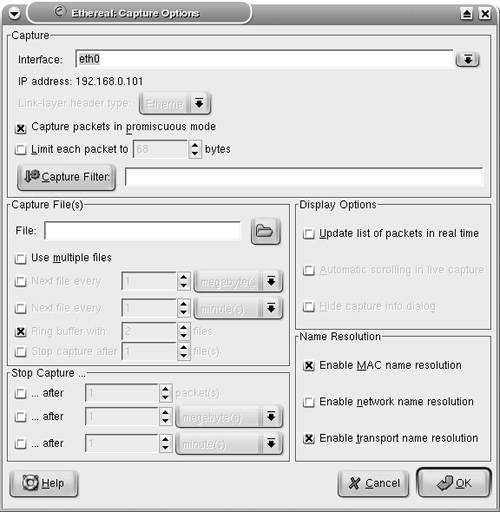 Viewing the Captured PacketsUnless an option is selected in the Stop Capture section, Ethereal continues to capture packets while displaying a summary through the Capture window (see Figure 7-12). To view the captured packets, you must stop the capturing process by clicking the Stop button in the Capture window. After stopping the capturing process, Ethereal automatically displays all the captured packets. Figure 7-12. Ethereal Capture Window Note Ethereal can display the packets in real time, as they are captured. To view packets in real time, you must choose the Update list of packets in real time option along with the Automatic scrolling in live capture option. Both of these options can be selected in the Display Options section of the Capture Options window. Filtering the OutputAs shown in Figure 7-13, Ethereal captures a large number of packets. In the upper pane, packet number 265 is highlighted. Ethereal has correctly identified the packet as a CDP packet. The middle pane shows the drilled-down packet details, such as the Device ID string that is contained in the CDP packet. The third pane shows the HEX and ASCII details. The string Router-Dallas is highlighted in both HEX and ASCII formats. Figure 7-13. Ethereal Packet Details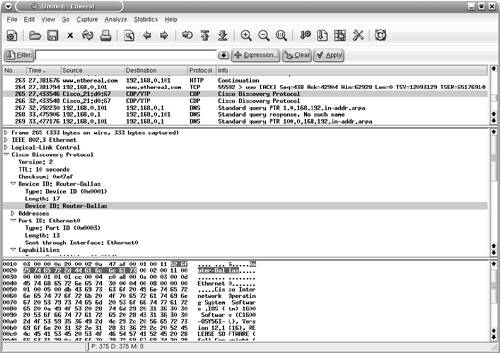 Ethereal also provides a GUI based filter tool for viewing selective packets. To launch the filter GUI, click on the Expression button on the toolbar. Figure 7-14 shows the Filter GUI. This example illustrates a filter for selecting packets destined for IP address 192.168.0.20. Figure 7-14. Ethereal Filter Expression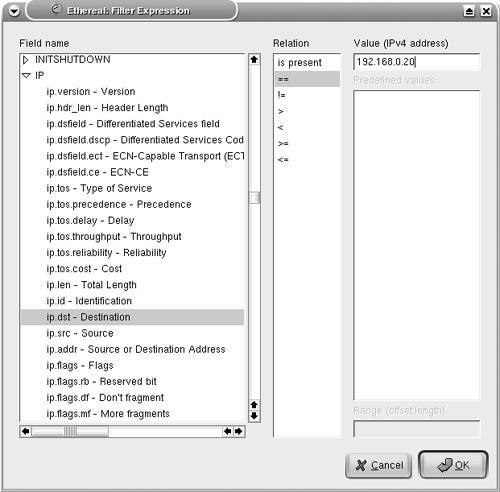 The resulting output is shown in Figure 7-15. Figure 7-15. Ethereal Filtered Output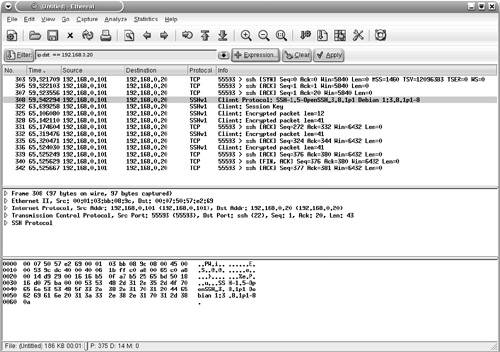 Saving the Captured FilesThe captured files can be saved for future use in various formats. To save the files, choose File > Save As and choose the desired format from the File type drop-down menu. Reassembling TCP PacketsTCP-based applications transfer data by breaking it into smaller pieces. The receiving host reassembles the pieces in the correct order to create the original data. Ethereal can watch a TCP conversation and reassemble the data for display in ASCII format. This feature is useful for troubleshooting mail, web, or Telnet applications. To re-create the TCP conversation, select and right-click one of the TCP packets in the upper pane. Select the Follow TCP Stream option (see Figure 7-16) to view the complete reassembled packet. Figure 7-17 shows the reassembled Telnet session to the host 192.168.0.20. Figure 7-16. Ethereal Follow TCP Stream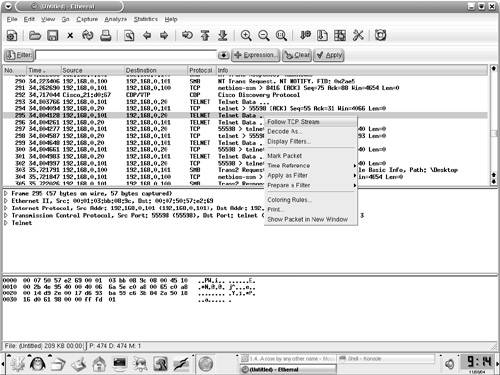 Figure 7-17. Ethereal Reassembled Packet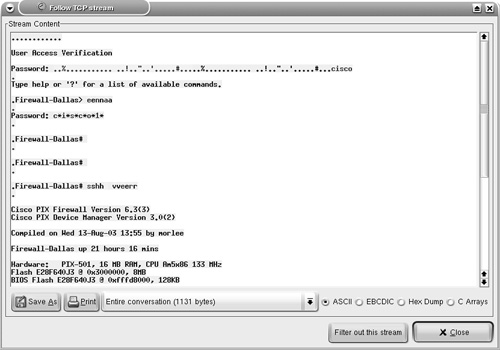 Note Nmap, Ethereal, and Tcpdump are also available for the MS-Windows OS; the Windows version is known as Windump. The URL for downloading each of the tools is listed in Table 7-10. The installation procedure is simple, and the usage is similar to the Linux counterpart, thus facilitating Netadmins with these versatile tools without having to leave the familiarity of the Windows environment.
|
EAN: 2147483647
Pages: 106