Who Am I?
| | | |||||||||||||||||||||||||||||
| | |||||
| | ||||
| | |||||
Simple Adaptive Subdivision
Every example application so far has rendered curves using a uniform sampling of points along the curve to construct a set of lines that could be drawn using DirectX. This method is very simple to implement, but it can be very inefficient. Many times, too many points are used to draw straight regions. Often, too few points are used to draw curvy regions . This is shown in Figure 6.1.
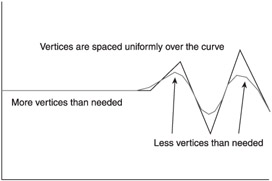
Figure 6.1: Uniform sampling on a curve.
| Note | It is important to point out that there are several methods for curve subdivision. Each method has tradeoffs in terms of speed, efficiency, and accuracy. I have chosen to describe a method that places clarity above efficiency. Once you understand the basic ideas, you might want to investigate other methods. |
In Figure 6.1, just as many points are used to draw the straight region as are used to draw the curved region. This is inefficient because the straight area is straight with more points than it needs and the curved area has visible corners. Obviously, it would be better to redistribute the points to where they are most needed. This is the purpose of adaptive subdivision.
The word subdivision implies that you are dividing the curve into several small pieces. With uniform subdivision, I was dividing a curve into a predefined set of line segments of uniform (parametric) length. Adaptive subdivision means that the subdivision is based on decisions about where the curve actually requires more points. Those decisions require some analysis of the shape of the curve and a set of criteria that can be used to decide if an area needs to be subdivided further. To better understand the process, start with Figure 6.2.
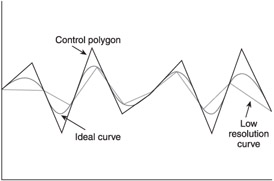
Figure 6.2: Subdividing a curve.
In Figure 6.2, the curve is rendered using as many vertices as there are control points. Unless the curve is very straight, this is probably the minimum number of vertices you'd ever use. There is another reason for this that you will see in a moment. Figure 6.2 shows both the very low-resolution curve and the ideal curve. The midpoint of each low-res line segment is compared to its counterpart on the ideal curve. Most subdivision schemes are based on the relationship between these two points. If the relationship passes some test, the line segment is used as is. Otherwise, it is split into two segments and the test is repeated on the two new line segments.
For this simple example, I have chosen to compare the distance between the two points to some tolerance factor. If the distance is greater than the tolerance value, another vertex is added at the ideal curve point. This is shown is Figure 6.3.
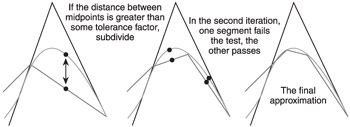
Figure 6.3: Subdividing a curve by comparing midpoints.
This process can be made to continue until either all segments pass the test or until the process exceeds a maximum number of vertices. Figure 6.4 shows one of the reasons why I started with more than one line segment.
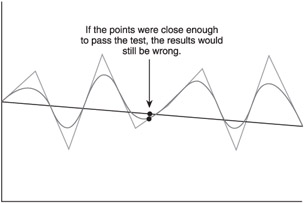
Figure 6.4: Problem with too few segments.
In Figure 6.4, the one line segment would pass the midpoint test and never get subdivided. This is clearly incorrect and is a form of the aliasing effect shown in Chapter 2. Some subdivision schemes account for this more elegantly, but defaulting to a higher number of line segments is an easy way to start and will never produce aliasing errors.
In the spirit of this direct approach, the full diagram for the scheme I use in this book is shown in Figure 6.5.
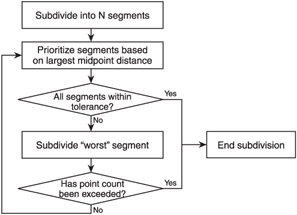
Figure 6.5: The subdivision approach.
This approach is slower than others because it sorts through the list of vertices each time and chooses the best case for subdivision. It might be slower, but it allows me to demonstrate several interesting features. If you knew that you only wanted to satisfy some tolerance value over all intervals, you could use an approach that linearly walks down the curve. The approach shown in Figure 6.5 is a simple way to subdivide based on the tolerance, a maximum number of vertices, or both. Also, the variable number of vertices has allowed me to demonstrate an alternate method of computing and setting the vertex positions .
The following section will highlight the code used for this subdivision scheme.
| | |||||
| | ||||
| | |||||
EAN: 2147483647
Pages: 104