Knot Vectors
| | | ||||||||||||||||||||||||
| ||||
| | ||||
Putting It All Together
The code for this chapter can be found on the CD in the \Chapter03 folder. Bezier CurveApplication.cpp contains all of the new code related to the subject of Bezier curves. The code is very simple, but it demonstrates everything you need to know about drawing Bezier curves. However, you should remember that none of the code in this book is optimized for performance. The emphasis is more on clarity and ease of explanation. If you'd like, you can see a higher-performance sample in Real-Time Rendering Tricks and Techniques in DirectX . I feature one example where a Bezier surface is drawn with the help of vertex shaders. That book also pays more attention to performance considerations.
The code begins with a set of definitions. I have hard-coded the basis functions, their derivatives, and a simple animation function. Remember, this code assumes you are dealing with four control points.
//Basis functions #define B0(t) ((1.0f - t) * (1.0f - t) * (1.0f - t)) #define B1(t) (3.0f * t * (1.0f - t) * (1.0f - t)) #define B2(t) (3.0f * t * t * (1.0f - t)) #define B3(t) (t * t * t) //Derivatives of the basis functions #define dB0(t) ((6.0f * t) - (3.0f * t * t) - 3.0f) #define dB1(t) (3.0f - (12.0f * t) + (9.0f * t * t)) #define dB2(t) ((6.0f * t) - (9.0f * t * t)) #define dB3(t) (3.0f * t * t) #define SLOPE_WIDTH 50.0f #define ANIMATE(x) (x * sin((float)GetTickCount() / 1000.0f))
The application animates the control points and refills the vertex buffer every frame. The FillCurveBuffer function does the majority of the work.
BOOL CBezierCurveApplication::FillCurveBuffer() { if (!m_pCurveVertices) return FALSE; GENERAL_VERTEX *pVertices; The vertex buffer is set up to hold the four control vertices (used to draw the control polygon), two vertices used to draw the slope, and a set of vertices that make up the actual curve. This function locks the whole buffer and sets all of these vertices.
if (FAILED(m_pCurveVertices->Lock(0, (6 + NUM_CURVE_VERTICES) * sizeof(GENERAL_VERTEX), (BYTE **)&pVertices, D3DLOCK_DISCARD))) return FALSE;
I begin by setting the control points. I have used a very simple animation function to provide some movement. You can change the function or change the values to see different curves. Note that all the values here are given as pixel coordinates.
pVertices[0].x = 100.0f + ANIMATE(100.0f); pVertices[0].y = 100.0f + ANIMATE(100.0f); pVertices[1].x = 300.0f; pVertices[1].y = 200.0f + ANIMATE(200.0f); pVertices[2].x = 400.0f + ANIMATE(50.0f); pVertices[2].y = 200.0f; pVertices[3].x = 600.0f; pVertices[3].y = 100.0f + ANIMATE(-100.0f); pVertices[0].color = pVertices[1].color = pVertices[2].color = pVertices[3].color = 0xFF000000; pVertices[0].z = pVertices[1].z = pVertices[2].z = pVertices[3].z = 1.0f;
This code sets the position for every point along the curve. It is actually very simple once you have defined the basis functions. This just finds the x and y values based on the basis functions and the control points that were just animated. Note that I am offsetting the index of the vertex by 6 to account for the control vertices and slope vertices in the beginning of the buffer. In this case, the code assumes that there are at most, 100 points on the curve.
int Index = 0; for (int i = 0; i <= 100; i += CURVE_RESOLUTION) { The value for t is found by dividing the value of i by 100. This yields a value of t between 0 and 1. This value is then used by the basis functions.
float t = (float)i / 100.0f; pVertices[Index + 6].x = (B0(t) * pVertices[0].x) + (B1(t) * pVertices[1].x) + (B2(t) * pVertices[2].x) + (B3(t) * pVertices[3].x); pVertices[Index + 6].y = (B0(t) * pVertices[0].y) + (B1(t) * pVertices[1].y) + (B2(t) * pVertices[2].y) + (B3(t) * pVertices[3].y); pVertices[Index + 6].z = 1.0f; pVertices[Index + 6].color = 0xFFFF0000; Index ++; }
This function is used to animate the point of interest when drawing the slope of the curve. It basically finds the current tick count on the system, changes it to a value between 1 and 100, and divides that value by 100 to yield a final value for t between 0 and 1.
float Point = (float)((GetTickCount() / 100) % 100) / 100.0f;
The following code finds the current point of interest based on the value of t. This is basically the same code as shown above, only this time it is only applied to the current location of the slope line.
float PointX = (B0(Point) * pVertices[0].x) + (B1(Point) * pVertices[1].x) + (B2(Point) * pVertices[2].x) + (B3(Point) * pVertices[3].x); float PointY = (B0(Point) * pVertices[0].y) + (B1(Point) * pVertices[1].y) + (B2(Point) * pVertices[2].y) + (B3(Point) * pVertices[3].y);
The following lines are used to find dx/dt and dy/dt.
float SlopeRun = (dB0(Point) * pVertices[0].x) + (dB1(Point) * pVertices[1].x) + (dB2(Point) * pVertices[2].x) + (dB3(Point) * pVertices[3].x); float SlopeRise = (dB0(Point) * pVertices[0].y) + (dB1(Point) * pVertices[1].y) + (dB2(Point) * pVertices[2].y) + (dB3(Point) * pVertices[3].y);
The slope can then be determined as shown in Equation 3.3. The remainder of the code sets the slope vertices as seen in the previous two chapters.
float Slope = SlopeRise / SlopeRun; float Angle = atan(Slope); pVertices[4].x = PointX + SLOPE_WIDTH * cos(Angle); pVertices[4].y = PointY + SLOPE_WIDTH * sin(Angle); pVertices[5].x = PointX - SLOPE_WIDTH * cos(Angle); pVertices[5].y = PointY - SLOPE_WIDTH * sin(Angle); pVertices[4].z = pVertices[5].z = 1.0f; pVertices[4].color = pVertices[5].color = 0xFF0000FF; m_pCurveVertices->Unlock(); return TRUE; }
Finally, the curve is actually drawn with the Render function.
void CBezierCurveApplication::Render() { CCurveApplication::Render(); FillCurveBuffer(); m_pD3DDevice->SetStreamSource(0, m_pCurveVertices, sizeof(GENERAL_VERTEX)); These lines draw the slope line first, followed by the curve and the control polygon. I chose the drawing order to best show the relationship between all three pieces, but you can change the order or turn off specific parts if you'd like.
m_pD3DDevice->DrawPrimitive(D3DPT_LINESTRIP, 4, 1); m_pD3DDevice->DrawPrimitive(D3DPT_LINESTRIP, 6, NUM_CURVE_VERTICES - 1); m_pD3DDevice->DrawPrimitive(D3DPT_LINESTRIP, 0, 3); }
Figure 3.8 shows a screenshot of the resulting application. Notice the line that shows the slope. You will get a better view by actually running the animated application.
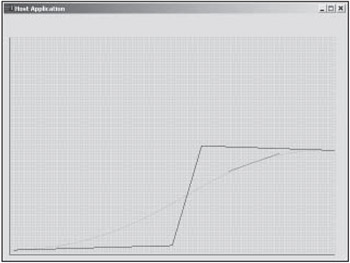
Figure 3.8: A screenshot of the application.
I have also included a function that draws the basis functions. This code was used to generate Figure 3.6. The function is a very bad example of performance coding because it generates a new vertex buffer each time it draws. It is included simply as a way to view the basis functions.
void CBezierCurveApplication::DrawBasisFunctions() { LPDIRECT3DVERTEXBUFFER8 pBasisVertices; I create 400 vertices, 100 for each of the four basis functions.
if (FAILED(m_pD3DDevice->CreateVertexBuffer( 400 * sizeof(GENERAL_VERTEX), D3DUSAGE_WRITEONLY D3DUSAGE_DYNAMIC, D3DFVF_GENERALVERTEX, D3DPOOL_DEFAULT, &pBasisVertices))) return; GENERAL_VERTEX *pVertices; if (FAILED(pBasisVertices->Lock(0, 400 * sizeof(GENERAL_VERTEX), (BYTE **)&pVertices, D3DLOCK_DISCARD))) return;
The following code sets the vertices for all four curves at one time. The code scales the values to fill the window by multiplying i by 6 and multiplying the results of the basis function by 400. See Figure 3.6 for the proper ranges for t and the basis functions.
for (long i = 0; i < 100; i++) { float t = (float)i / 99.0f; pVertices[i].x = i * 6; pVertices[i + 100].x = i * 6; pVertices[i + 200].x = i * 6; pVertices[i + 300].x = i * 6; pVertices[i].y = 400.0f * B0(t); pVertices[i + 100].y = 400.0f * B1(t); pVertices[i + 200].y = 400.0f * B2(t); pVertices[i + 300].y = 400.0f * B3(t); pVertices[i].z = pVertices[i + 100].z = pVertices[i + 200].z = pVertices[i + 300].z = 1.0f; pVertices[i].color = pVertices[i + 100].color = pVertices[i + 200].color = pVertices[i + 300].color = 0xFFFF0000; } pBasisVertices->Unlock(); The curves are drawn by the following code.
m_pD3DDevice->SetStreamSource(0, pBasisVertices, sizeof(GENERAL_VERTEX)); m_pD3DDevice->DrawPrimitive(D3DPT_LINESTRIP, 0, 99); m_pD3DDevice->DrawPrimitive(D3DPT_LINESTRIP, 100, 99); m_pD3DDevice->DrawPrimitive(D3DPT_LINESTRIP, 200, 99); m_pD3DDevice->DrawPrimitive(D3DPT_LINESTRIP, 300, 99); pBasisVertices->Release(); }
Feel free to experiment with the positions of the control points to see the curves that they yield. Also, you may want to experiment with joining multiple curves. I will leave that up to you.
| | ||||
| ||||
| | ||||
EAN: 2147483647
Pages: 104
- Challenging the Unpredictable: Changeable Order Management Systems
- Enterprise Application Integration: New Solutions for a Solved Problem or a Challenging Research Field?
- Context Management of ERP Processes in Virtual Communities
- A Hybrid Clustering Technique to Improve Patient Data Quality
- Relevance and Micro-Relevance for the Professional as Determinants of IT-Diffusion and IT-Use in Healthcare