The UML Deployment Diagram: Similar, but Not the Same
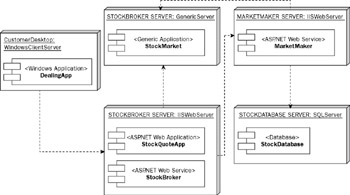
The name Deployment Designer inevitably conjures up a comparison with the UML deployment diagram. Indeed, Figure 4-13, an equivalent deployment diagram drawn in UML, bears a striking resemblance to the Visual Studio 2005 deployment diagram shown in Figure 4-3.

Figure 4-13
You can see that we have used UML components to represent the applications, an analogy that we first established in Chapter 2. UML nodes have been used to represent logical servers, and the binding of components onto nodes (refer to Figure 4-13) is equivalent to the binding of applications onto servers (refer to Figure 4-4). Dependencies between nodes in Figure 4-13 reflect the connections between servers in Figure 4-4.
Thus, the correlation between the two notations is high, with some notable anomalies such as the lack of support for zones in the UML notation.
Despite that high correlation, the two notations are not exactly equivalent in the sense of a one-to-one correspondence. As discussed previously, the single UML deployment diagram actually maps to a combination of two distributed system designers—Logical Datacenter Designer and Deployment Designer. Thus, the distributed system designers provide greater flexibility by decoupling the logical datacenter definition from the binding of application components onto logical server nodes.
Furthermore, System Designer allows anticipated deployment settings and constraints (specified using Application Designer and, in the case of settings, overridden in System Designer) to be defined separately from the actual deployment settings and constraints specified using Logical Datacenter Designer.
Dynamic Modeling
While on the subject of UML we'll revisit the topic of dynamic modeling. You might remember that in Chapter 2 we indicated that the Distributed System Designers do not (yet) provide dynamic modeling capabilities analogous to the UML sequence and collaboration diagrams.
We suggested that you could simulate a UML collaboration diagram by adding numbered comments to the links between applications on an application diagram—to show the sequence of calls or messages between the application services. Refer back to Chapter 2 to see a sample application diagram marked up in that way. The main problem with that idea is that you are allowed only one application diagram per solution, so unless you create multiple solutions simply for documentation purposes, you can only ever show one interaction scenario.
The good news is that System Designer has no such limitation; you can create as many system diagrams as you like. In addition, because system diagrams are visually very similar to application diagrams, you can apply the same technique. Better still, because a system diagram can contain a subset of the complete application set, you can create a separate diagram for each set of collaborating applications in each scenario.
That's perhaps not what System Designer was intended for, but as a handy workaround it's the closest you'll get to model the dynamic (runtime) behavior of your applications using the current set of distributed system designers.
EAN: 2147483647
Pages: 220