12.2 Exchange 2003 Management Pack
|
| < Day Day Up > |
|
MOM includes a Base Management Pack that provides predefined management modules needed to monitor and to manage Windows and key components that are part of a networked Windows environment. Microsoft also provides separate Application Management Packs that provide MOM support for key BackOffice products, including Exchange.
| Note | MOM has separate management packs for Exchange 5.5 and Exchange 2000. Microsoft includes an Exchange 2003 management pack in the Exchange 2003 kit. |
Management Packs include predefined computer groups, processing rules, computer attributes, providers, filters, alerts, scripts, performance threshold rules, public views, notification groups, reports, and knowledge base articles. Each module within a Management Pack provides a complete off-the-shelf MOM management solution for a specific application or service. You can customize and extend the predefined support in the MOM Management Packs to tailor MOM for your own environment.
The combination of MOM and the Exchange Management Pack permits administrators to monitor a large number of Exchange servers (and related infrastructure components) simultaneously from a central console, even in a geographically widely dispersed environment. Without an automated tool, such as MOM, providing a highly available Exchange-based messaging service is very labor intensive. You would need to use various management tools (e.g., PerfMon, Event Viewer, Exchange System Manager [ESM]) on multiple systems watching for indications of impending problems.
Once the IT staff masters MOM and the Exchange rules, MOM can decrease the total cost of ownership for running a highly available messaging service.
The Exchange Management Pack gathers data from many data sources and watches for the early warning signs of a large number of potential problems. The goal is to discover these problems before they can cause a service interruption. If you do have a service interruption, MOM facilitates quick restoration of the service by providing hints on troubleshooting the problem.
12.2.1 Exchange 2003 rules
The Exchange Management Pack goes beyond simple event gathering by using out-of-the-box rules to determine whether an event is relevant to an Exchange administrator. MOM gathers only those events that might indicate an impending problem or that require action on the part of the administrator while simultaneously filtering out events that require no action. Microsoft wanted to avoid producing too many alerts. The goal was to produce a limited number of highly relevant alerts and to suppress repetitive and related events to decrease the 'noise.' This is important, because if a monitoring tool produces too many alerts, operators begin to overlook critical alerts.
The Exchange Management Pack contains rules and scripts that determine the types of events to monitor and the actions to take in response to certain events. MOM monitors all types of Exchange servers appropriately. MOM applies the appropriate rules for clusters, front end servers, and back end servers. For the most part, you can use the rules and scripts exactly as supplied by Microsoft. However, you also can customize them with your own threshold values.
You can find the Exchange rules in the Rules Microsoft Management Console snap-in of the MOM Administrator Console. The Exchange rules folder contains subfolders for various components and for performing specialized tasks for server availability, server health monitoring, and server use logging. The following sections describe these subfolders.
Monitoring events produced by Exchange components
If you only monitor the state of your services-i.e., whether the Exchange services are running and whether your database is mounted-you will not know about a problem until you have a service interruption. The heart of the Exchange management pack comprises the rule groups shown in Figure 12.11 that monitor and collect detailed information from events generated by the Exchange components. These events are the single richest source of information about the details of activities on an Exchange server and provide early indications of problems so you can avoid service interruptions.
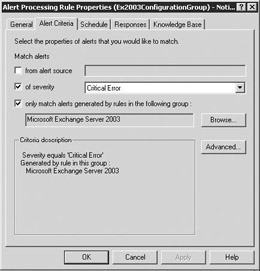
Figure 12.11: Alert processing rules
The Exchange Management Pack has rules to look at more than 1,700 critical events produced by the Exchange components. This may seem like a large number, but it is only a fraction of the approximately 16,500 events produced by the Exchange components. The 1,700 critical events are the ones that require immediate administrator attention. Each of these events has a severity level and contains knowledge base information that tells you the meaning of the event, how to investigate the problem, and how to correct the problem.
The Exchange Management Pack module monitors events generated by various Exchange components shown in Figure 12.12.
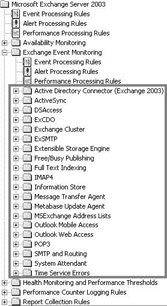
Figure 12.12: Exchange component events
Availability monitoring
The set of rules shown in Figure 12.13 is for availability-i.e., monitoring and assuring that your servers and services are available. There are several components of server availability, including the following:

Figure 12.13: Availability monitoring
-
Server Heartbeat. MOM, rather than the Exchange Management Pack, provides the server heartbeat functionality. The MOM agent on the managed server periodically sends a heartbeat message to the CAM to let the CAM know that the server is still running and is connected to the network. This is essential because, if the agent is not running or not connected to the network, the CAM will not be receiving any alerts from the server, and the only indication of a problem will be the lack of the heartbeat.
-
Database Mounted Check. The Database Mounted script verifies that the Exchange databases on each server are mounted. MOM will generate an alert when any of the databases are not mounted.
Note Other MOM event monitoring should warn you of impending problems (e.g., low disk space) before the problems reach the point where Exchange automatically (and unexpectedly) dismounts a database. These other alerts should provide enough advanced notice so you can avoid the service interruption.
-
MAPI Logon Check and Availability Reporting. This script periodically logs into a test account mailbox on each server and verifies that Exchange is running, the database is mounted, and Exchange can contact the Active Directory to authenticate users. MOM will generate an alert if the Messaging Application Programming Interface (MAPI) logon test fails. You should specify a different test mailbox for each database on each server because the Exchange Management Pack uses the MAPI Logon Check to gather availability summary data about the databases.
-
Unexpected Service Termination. These rules watch for events indicating an unexpected termination of Exchange-related services on Exchange servers. MOM generates an alert when a service has terminated unexpectedly, as indicated by event ID 7031.
-
Verify Agent Mailbox Configuration. These rules verify that the MOM test mailbox accounts (used by the verify mail flow and MAPI logon check rules) are correctly configured.
-
Verify Exchange Services. This set of scripts watches for the Exchange services that should be running on each server. MOM will generate an alert when any of the services are not running. Because each server may have a different role, and you may be running different services on each server, you can independently specify the set of services you want to monitor on each server.
Note Other MOM event monitoring should warn you of impending problems before the problems reach the point at which the service crashes.
-
Verify Mail Flow. This script periodically sends test messages between servers to verify e-mail connectivity. This is useful if you have Exchange servers in multiple locations and you want to be sure that mail is getting to the remote locations. MOM will generate an alert if an expected test message fails to arrive or if the mail takes too long to arrive. MOM also uses the Mail Flow Verification script to gather data on mail delivery latency so that you can check the latency over a period to verify that you are meeting your SLAs or to see whether the delivery times are growing.
Health Monitoring and Performance Thresholds
Continuous monitoring of system health is one of the keys to maintaining high server availability. The Exchange Management Pack monitors system and Exchange-specific resources that provide early warnings of potential problems. MOM also collects performance data from the Exchange servers and generates an alert if the collected data exceed critical thresholds. Exceeding thresholds is usually an indication that the server is running low on resources. The Health Monitoring and Performance Thresholds rules (Figure 12.14) include scripts that monitor Exchange messaging queues, free disk space, and relevant server performance metrics.
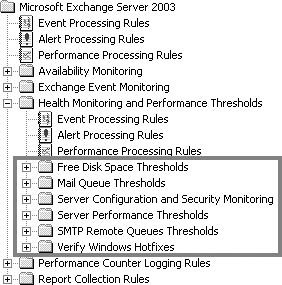
Figure 12.14: Health Monitoring and Performance Thresholds
-
Free Disk Space Thresholds. Running out of disk space is a preventable- but all too common-cause of Exchange service interruptions. The Monitor Free Disk Space script monitors the available disk space of each drive on each server running Exchange. The script has default settings for all disks, but you can configure the thresholds for individuals disks on the basis of the type of data contained on drives. For example, you can set separate thresholds for the disks that contain Exchange log files, Exchange database files, and message queue files. The usage patterns for the log file disks and message queue disks tend to be different from the usage patterns for database disks. Unless you are moving users, database files tend to grow slowly over time. Therefore, you can set a small threshold, maybe 10%, and MOM will warn you when the free disk space decreases to less than 10% on that drive. However, log file disks and message queue disks can grow quickly if Exchange cannot send Simple Mail Transfer Protocol (SMTP) mail to the Internet or if your backup software is failing to remove old log files. For these disks, you probably want a higher threshold, maybe 40%.
-
Mail Queue Thresholds. MOM monitors all Exchange mail queues (e.g., SMTP queues, Message Transfer Agent [MTA] queues, internal mail delivery queues, and others) to ensure that the number of queued entries does not exceed the threshold for each queue. This ensures that mail is flowing properly throughout your environment. MOM will generate an alert if the number of entries in a queue exceeds the threshold for that queue. MOM also enumerates the individual remote queues. If one of the remote delivery queues contains an excessive number of unsent messages, MOM will tell you where Exchange is trying to send the messages-i.e., the remote domain to which Exchange cannot forward mail. You also can view the queue length data graphically to show changes over a period. Although it is normal for queue lengths to fluctuate, a steady increase in queue length can indicate a message delivery blockage. The graphical view allows you to see whether the queues are growing and how fast they empty.
-
Server Configuration and Security Monitoring. These rules check for common Exchange configuration errors and recommended configuration settings, such as SMTP anonymous relay, log files on the same drive as database files, mailboxes on front end servers, circular logging, and so on.
-
Server Performance Thresholds. This series of rule groups monitors server performance to verify that your Exchange servers are functioning properly. These server performance rules are important because every alert generated in this area represents a problem that users will notice and will report as 'sluggish' e-mail response. Monitoring these measurements allows you to know about these potential problems before your users start calling. These rules monitor areas such as the following:
-
Disk latency. MOM monitors disk latency to verify that disk drives are responding in sufficient time. You can get an early indication of disk bottlenecks by watching for increasing disk latency.
-
RPC requests. MOM monitors the number of outstanding Remote Procedure Call (RPC) requests. The MAPI Outlook client communicates with the Exchange server using RPCs. A growing number of outstanding RPC requests is often an indication of a server resource bottleneck (e.g., disk bottleneck or CPU bottleneck) because the RPCs are arriving at a rate faster than the server can process. The number of outstanding RPC requests varies considerably during the day but is usually small on a healthy server (fewer than 10).
-
RPC latency. MOM also measures the actual RPC latency. This is the elapsed time starting when server receives a request and ending when it completes processing the request and sends the response back to the client. You can track the latency over a period to watch for changes that may indicate the need for additional processing power.
-
CPU usage. MOM monitors CPU usage and will generate an alert when the CPU usage exceeds the predefined threshold.
-
-
SMTP Remote Queues Thresholds. These rules monitor the state and health of the Exchange SMTP remote queues and generate an alert if a significant amount of mail is queued for a specific location. You can configure the queued message alert threshold by changing the NumberOfMessages script parameter.
-
Verify Windows Hotfixes. These rules verify whether you have installed all specified Windows hotfixes on the Exchange servers. MOM generates an alert if you have not installed a specified hotfix.
Performance Counter Logging Rules and Report Collection Rules
The Performance Counter Logging Rules and Report Collection Rules (Figure 12.15) collect Performance Monitor data for logging and reporting. MOM includes reports and graphical views for measurements, such as CPU usage, disk capacity, performance, Exchange protocol usage, mail queues, memory, network, and others.

Figure 12.15: Performance Counter Logging Rules and Report Collection Rules
These processing rules periodically collect and save many different performance counters. The collection of this information is critical for establishing a baseline that describes a healthy, properly functioning Exchange server. When a server becomes unhealthy, you can quickly determine what has changed by comparing the current collection of measurements for the unhealthy server with the baseline data for the same server when it was healthy. Maybe you decommissioned another Exchange server moving that server's users to the now unhealthy server, and the additional user load has overtaxed the server. Maybe someone moved files, and the files are no longer in the optimal configuration. Maybe your system is under attack from a virus that is causing an abnormal amount of mail traffic. Comparing the current measurements with the baseline data will help you to diagnose the root cause for the current problem.
12.2.2 Knowledge Base
Perhaps the most valuable component of the Exchange Management Pack is the knowledge base that contains knowledge about common Exchange problems. When you get an alert, the knowledge base provides you with information about the meaning of the alert, how to investigate the problem, and how to correct the problem. The integrated knowledge base enables less-experienced, first-tier support staff to resolve more issues rather than escalating the problems to more senior support personnel.
The Microsoft Exchange team, rather than the MOM team, developed this knowledge base, and it includes information from Microsoft PSS, from Microsoft's Internal Technology Group, and from customers on real world Exchange implementations. Because the Microsoft Exchange team controls the knowledge base information, they can ensure that the knowledge base stays current as they add new features to Exchange. The Microsoft Exchange team also plans to take the information gathered from PSS, Internal Technology Group, and customers to add new Exchange features that will improve manageability.
There are two major sections to the knowledge base information window. The top half is the Microsoft-supplied knowledge base and includes a Summary section describing the problem, a Causes section providing an indication as to what the root causes might be, a Resolutions section providing recommendations about how you should deal with this problem, and an External Knowledge Sources section containing external links to Microsoft websites. The first external link is to a website where Microsoft may have updated information about the problem. The second external link does a search against the Microsoft knowledge base to try to find articles relevant to this particular event. The bottom part of the Knowledge Base window contains your own Company Knowledge Base where you can document additional company-specific information about how your enterprise deals with this particular problem.
Microsoft does not yet have knowledge base information for each of the 1,700 events, but they have information for the events customers have reported and for the events seen in their own internal deployment. They also have documented the high-severity rules. Documenting all 1,700 events is a labor-intensive process, but Microsoft has promised continued improvements in future releases.
12.2.3 Exchange public views
MOM includes several public views (Figure 12.16) that allow you to view the collected data in an organized manner. These views provide a snapshot of the health of your Exchange implementation. You can use the MOM console or the MOM web browser to view the collected events and alerts. MOM organizes the Exchange events and alerts into the following categories.
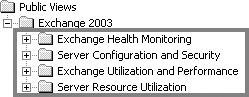
Figure 12.16: Exchange Public Views
Exchange Health Monitoring
-
Alerts on Exchange 2003 Servers. This category includes acknowledged alerts, alerts in the last 24 hours, all alerts, MOM Agent communication failure alerts, new alerts, resolved alerts, and unresolved alerts.
-
Exchange Database Maintenance. This category includes free disk space available after online defragmentation, online defragmentation events, and database backup status (all database backup events, backup errors or failures, database files only, log files only, all events, backup errors or failures).
-
Mail Flow Performance. This category includes mail flow latency warnings, mail flow messages sent successfully, mail flow warning events (not latency events), mail flow latency in the last 2 hours, and mail flow latency in the last 24 hours.
-
MAPI Logon Performance. This category includes MAPI logon success events, MAPI logon warning events, MAPI logon latency in the last 2 hours, and MAPI logon latency in the last 24 hours.
-
Exchange Core Health Metrics. This category includes disk read and write latency, private bytes and virtual bytes in the Information Store, RPC packet latency, RPC outstanding requests, and total percentage CPU usage.
-
Mail Queues. This category includes information for the various Exchange queues, including pending routing queue, pending reroute queue, SMTP queues, work queues, local queues, local retry queues, remote queues, remote retry queues, categorizer queues, and MTA queues.
-
Events that generated alerts (last 2 hours). This view lists all alerts on the Exchange servers from the past 2 hours.
-
Windows Start and Stop events. This view lists all service start and stop events on the Exchange servers.
-
Exchange 2003 Computers. This view lists the overall status for all Exchange servers.
-
Exchange Computer Groups. This view lists the overall status for Exchange servers grouped by categories (e.g., those servers running Active Directory Connector, those running Exchange 2003, and so on).
Server configuration and security
-
Configuration Warning Events. This category includes Exchange servers needing 3 gigabytes enabled, duplicate proxy address warnings, and mailbox stores with no agent mailbox for MAPI logon.
-
Antivirus Statistics. This category includes virus scan-related informational events, virus scan stop and start events, virus scan messages deleted, and virus scan messages deleted per second.
-
Configuration Information. This category includes all server configuration events, Exchange servers in a cluster (Exchange virtual servers), Exchange servers not in a cluster, logical disk information, physical servers, and storage group and database configuration.
-
Outlook Mobile Access. This category includes attempted access disallowed and connection problems.
-
Script Reporting Events. This category includes mailbox and public folder statistics events, report collection events, and service verification events.
-
Servers Ready For SetCredentialUtility. SetCredentialUtility cannot be run until the server has produced an Exchange MOM 9986 event at least once. This view lists the Exchange servers that have produced the 9986 event.
Exchange utilization and performance
-
Active Directory Connector. This category includes a summary of replication events and other information about the Active Directory Connectors.
-
Client Monitoring. This category includes client monitoring warning events, RPC latency information, RPCs attempted per second, RPCs failed per second, RPCs failed per second by error types, RPCs succeeded per second, and total reported latency.
-
Active Sync. This category includes categorizer notifications sent per second, client changes per second, current users, OmaSink notifications sent per second, OmaSink OnSave events per second, outstanding server inbound/outbound requests, server changes per second, total number of categorizer notifications sent since the last service start, total number of unrecognized requests since the last service start, and the total number of users since the last service start.
-
DSAccess. This category includes the duration of the last DNS query, Lightweight Directory Access Protocol (LDAP) search time, LDAP searches per second, the number of in-site domain controllers, the number of in-site global catalogs, the number of out-of-site domain controllers, the number of out-of-site global catalogs, and DSAccess domain controllers (all DSAccess domain controller counters, LDAP read time, LDAP reads per second, and number of outstanding requests).
-
ESE. This category includes the database percentage cache hits, database cache size, database table opens per second, and the log generation checkpoint depth.
-
IMAP4. This category includes current connections, fetches per second, logons per second, and User Identification commands per second.
-
Mailbox Store. This category includes active client logons, client logons, folder opens per second, local deliveries per second, message opens per second, message recipients delivered per minute, messages delivered per minute, messages sent per minute, messages submitted per minute, and uptime.
-
Message Transfer Agent (MTA). This category includes message bytes per second, messages processed per second, total inbound messages, and total outbound messages.
-
Outlook Mobile Access. This category includes browse rate, calendar request rate, contact request rate, HyperText Transfer Protocol status counts, inbox requests rate, last response time, and task request rate.
-
Outlook Web Access. This category includes authentications per second, current web service connections, message opens per second, message sends per second, number of recent users, total messages opened, and total messages sent.
-
POP3. This category includes current connections, logons per second, and messages retrieved per second.
-
Public Folder Store. This category includes active client logons, client logons, message recipients delivered per minute, messages delivered per minute, messages sent per minute, and messages submitted per minute.
-
Remote Procedure Calls (RPC). This category includes the number of slow RPC packets, outstanding RPC requests, RPC operations per second, RPC packet latency, and RPF packets per second.
-
SMTP. This category includes message bytes received per second, message bytes sent per second, messages delivered per second, messages received per second, and total messages submitted.
Server resource utilization
-
Disk Capacity. This category includes free space available after online defragmentation, percentage free space, and free megabytes.
-
CPU Usage. This category includes the percentage of CPU used for the Exchange Information Store process, the percentage of CPU used for the Windows NT LanManager Security Support Provider (lsass) process, the percentage of CPU used for the Microsoft Exchange System Attendant (mad) process, the percentage of CPU used for the Exchange MTA (emsmta) process, the percentage of CPU used for the IIS (inetinfo) process, the percentage of CPU used for the Microsoft Search process, the percentage of CPU used for the MOM Onepoint process, context switches per second, processor queue length, and total percentage CPU usage.
-
Disk Performance. This category includes average disk queue length, current disk queue length, disk read and write latency, and disk reads and writes per second.
-
Memory Usage. This category includes the IIS working set, private bytes used by the Information Store, virtual bytes used by the Information Store, virtual memory (all counters) used by the Information Store, virtual memory (largest block size) used by the Information Store, virtual memory (total 16 MB or larger free blocks) used by the Information Store, virtual memory (total free blocks) used by the Information Store, virtual memory (total size of all large free blocks) used by the Information Store, Information Store working set, memory page reads per second, memory page writes per second, memory pages per second, memory pool nonpaged bytes, memory pool paged bytes, and MTA working set.
-
Network Usage. This category includes bytes received per second, bytes sent per second, and total bytes per second.
12.2.4 Exchange reports
MOM includes 34 out-of-the-box Exchange reports that allow you to view the collected data in an organized manner. These reports help you analyze and graph performance data to understand usage trends, perform accurate load balancing, and manage system capacity. The Exchange Management Pack organizes the reports into the six categories described in the following sections.
Exchange 2000 and 2003 Health Monitoring and Operations
The Health Monitoring and Operations reports summarize Exchange health, Exchange usage, server availability, and Exchange server configuration.
-
Exchange 2003 Outlook Client Monitoring. This report provides Outlook client RPC performance and failures for a specified time.
-
Exchange Database Sizes. The database sizes report provides the file sizes of the Exchange databases, summarized by database, storage group, and server (Figure 12.17).
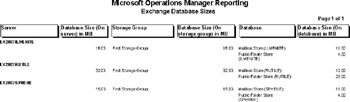
Figure 12.17: Exchange database sizes -
Exchange Disk Usage. The disk usage report provides the Exchange server disk usage. The report includes daily averages for each counter and the highest average in a 30-minute period for each counter (including the time that the highest average occurred).
-
Exchange Mailboxes. The mailboxes per server report lists the distribution of mailboxes across storage groups and databases. The report shows the number of mailboxes and the maximum limit for mailboxes for each server, storage group, and database.
-
Exchange Server Availability. The server availability report summarizes the measured availability of each of the databases on each of the servers during a specified period. MOM uses the MAPI Logon Check script to gather data about server availability.
-
Exchange Server Configuration. The server configuration report includes a large amount of information about your Exchange server configuration, including number and type of processors, amount of L2 cache, page file location and size, installed hotfixes, message queue directory location, storage groups, state of circular logging, location of essential files, and other information. Having all of this information in a single report keeps you from having to dig through various administrative tools to collect this information.
Exchange 2000 and 2003 protocol usage
The protocol usage provides summary information about the use of the Exchange messaging protocols. The Exchange Management Pack includes the following protocol reports:
-
Exchange IMAP4 Usage
-
Exchange Information Store Usage
-
Exchange Mailbox Store Usage
-
Exchange MTA Usage
-
Exchange POP3 Usage
-
Exchange Public Store Usage
-
Exchange SMTP Usage
-
Exchange Web Mail Usage
Exchange 2000 and 2003 traffic analysis
The mail traffic analysis reports show which mailboxes are sending and receiving the most messages and which Internet domains are sending and receiving the most mail to and from your servers. You can sort these reports either by the total message size or by the message count. The Exchange Management Pack includes the following traffic analysis reports:
-
Mail Delivered - Top 100 Recipient Mailboxes by Count (Figure 12.18)
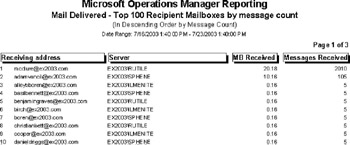
Figure 12.18: Mail Delivered - Top 100 Recipient Mailboxes by Count -
Mail Delivered - Top 100 Recipient Mailboxes by Size
-
Mail Delivered - Top 100 Sender Domains by Count
-
Mail Delivered - Top 100 Sender Domains by Size
-
SMTP Out - Top 100 Recipient Domains by Count
-
SMTP Out - Top 100 Recipient Domains by Size
-
SMTP Out - Top 100 Senders by Count
-
SMTP Out - Top 100 Senders by Size
Exchange capacity planning
The capacity planning reports summarize Exchange server resource usage to help you plan for current and future capacity needs. The Exchange Management Pack includes the following capacity planning reports:
-
Active Client Logons by Day
-
Client Logons by Day
-
Message Recipients Delivered per Minute by Day
-
Messages Sent per Minute by Day
-
MTA Messages per Second by Day
-
MTA Work Queue Length by Day
Exchange mailbox and folder sizes
In addition to the reports showing the number of mailboxes per database, MOM also includes reports that show you the largest mailboxes or the largest public folders per server. You can sort the data in these reports by the total mailbox size (i.e., storage space required for the mailbox) or by the mailbox message count. The Exchange Management Pack includes the following mailbox and folder size reports:
-
Highest Growth Mailboxes
-
Highest Growth Public Folders
-
Top 100 Mailboxes by Message Count
-
Top 100 Mailboxes by Size
-
Top 100 Public Folders by Message Count
-
Top 100 Public Folders by Size
Exchange performance analysis
The Exchange Management Pack includes a single performance analysis report that summarizes your message queue size performance.
|
| < Day Day Up > |
|
EAN: 2147483647
Pages: 128