That s Out of One Hundred
That's Out of One HundredBy default, the value axis on a graph will be slightly more than the largest value in your data. To set a specific maximum value (such as 100), select the graph, and go to Object>Graph> Type. In the dialog, choose Value Axis from the pop-up menu at the top. Check the Override Calculated Values box and enter the maximum value (100 in our example). Note: The maximum value you choose will become the default, so be prepared to change it back the next time you create a graph. 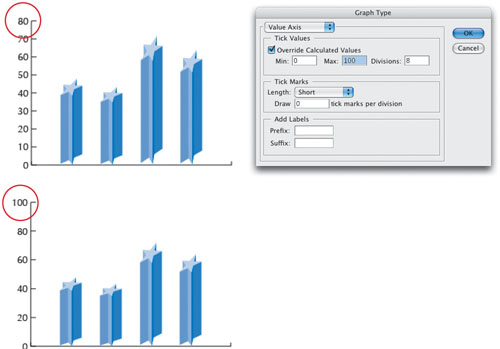 |
Illustrator CS2 Killer Tips
ISBN: 032133065X
EAN: 2147483647
EAN: 2147483647
Year: 2006
Pages: 473
Pages: 473
Authors: Dave Cross, Matt Kloskowski