Analyzing XML Data with Microsoft Excel
XML and Microsoft Excel workbooks are both designed to handle structured data, which makes Excel a natural choice to present XML data in its familiar pattern of worksheet columns, rows, and cells. However, because XML documents contain elements that can be related to other elements that don’t lend themselves to a row-and-column layout, Excel must use a special algorithm to “flatten” XML data into a two-dimensional representation. Excel can avoid using the flattening algorithm if the XML data you’re working with adheres to a schema created by Microsoft. I’ll describe this schema later in the chapter.
Understanding and Working with the XML Spreadsheet Flattener
You can open any well-formed XML file in Excel 2002. To do so, click Open on the File menu and then select XML Files in the Files Of Type list. Once you open the XML file in Excel, you can analyze the XML data as if it were native Excel data.
Excel worksheets are two-dimensional rows and columns, and because XML data can have more than two dimensions, a flattening algorithm is used to force the XML data into worksheet cells. When you open an XML file in Excel that is not provided in the XML Spreadsheet schema (described later in this chapter), Excel uses the algorithm to load the XML data into columns, rows, and cells. The XML tags appear as column headings, and the data appears in rows below the appropriate column headings. XML files are opened as read-only in Excel so that you do not accidentally save your original XML file in the XML Spreadsheet schema format.
To see how this works, if you have not done so already, use Internet Explorer to open the ![]() CustList.xml file in the Chap10 folder. With the file open in Internet Explorer, open the same file in Excel for comparison. You can see the differences in how the XML data is presented in Internet Explorer and Excel in Figure 10-1 and Figure 10-2.
CustList.xml file in the Chap10 folder. With the file open in Internet Explorer, open the same file in Excel for comparison. You can see the differences in how the XML data is presented in Internet Explorer and Excel in Figure 10-1 and Figure 10-2.
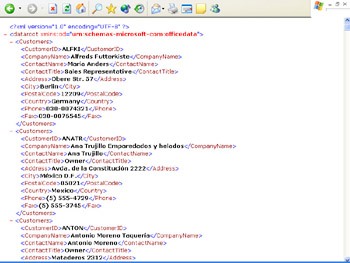
Figure 10-1: The CustList.xml file displayed in Internet Explorer 6.
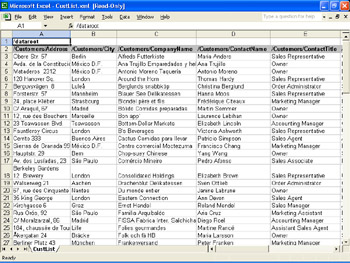
Figure 10-2: The CustList.xml file displayed in Excel 2002.
You should notice first that Excel presents the data from left to right in columns and rows, while Internet Explorer presents the data from top to bottom, with one element per line. The second difference to notice is that Internet Explorer presents the element names in XML notation, while Excel presents the element names in hierarchical notation. For instance, every Customers element in the XML file has a child element CustomerID. Excel represents the CustomerID element as /Customers/CustomerID. Third, Internet Explorer presents elements in the order in which they occur in the XML file; Excel presents the element names in alphabetical order. Also of note, empty elements or missing elements appear as blank cells in Excel, and the document element (dataroot in this example) occurs on the first row by itself.
Finally, this XML file does not show how attributes and data summarizations are handled. To see how these work, use Internet Explorer to open the ![]() CustOrds.xml file in the Chap10 folder. With the file still open, open the file in Excel 2002 for comparison. The different views of the file are shown in Figure 10-3 and Figure 10-4.
CustOrds.xml file in the Chap10 folder. With the file still open, open the file in Excel 2002 for comparison. The different views of the file are shown in Figure 10-3 and Figure 10-4.
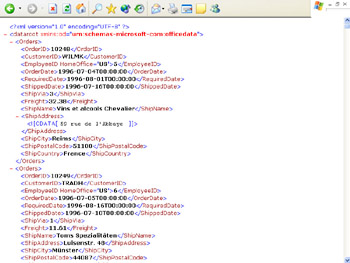
Figure 10-3: The CustOrds.xml file displayed in Internet Explorer 6.
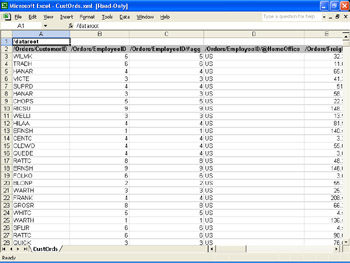
Figure 10-4: The CustOrds.xml file displayed in Excel 2002.
In the XML file, every Orders element contains an EmployeeID element with a HomeOffice attribute. In Excel, the attribute is preceded by an @ symbol; for example, /Orders/EmployeeID/@HomeOffice. Also, whenever Excel sees an XML element that appears to include numerical data, Excel tries to perform a summarization (or aggregation) of the data values, with the result of the aggregation appearing with an #agg designation. (Notice in this case that Excel thinks the EmployeeID, OrderID, and ShipVia elements are numerical, but in reality they are just identifiers.)
Your Turn
In this exercise, you will see how you can use Excel data analysis features to work with XML data. You will use an XML file, flattened by Excel, to display only those rows from customer ALFKI. You will then look at the XML data presented in a PivotTable report.
-
If you have not done so already, open the
 CustOrds.xml file (in the Chap10 folder) in Excel 2002.
 -
On the Data menu, point to Filter and then click AutoFilter.
-
In cell A2, click the arrow, and then click ALFKI in the list. Only rows for customer ALFKI are displayed, as shown in Figure 10-5.
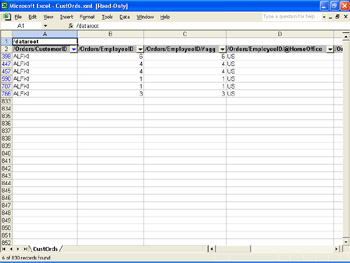
Figure 10-5: Orders for customer ALFKI only. -
On the Data menu, click PivotTable And PivotChart Report, and then click Finish.
-
Drag the /Orders/CustomerID icon from the PivotTable field list to the Drop Page Fields Here area of the PivotTable report.
-
Drag the /Orders/EmployeeID icon from the PivotTable field list to the Drop Row Fields Here area of the PivotTable report.
-
Drag the /Orders/CustomerID icon from the PivotTable field list to the Drop Data Fields Here area of the PivotTable report.
-
Click the arrow in cell B1 (the /Orders/CustomerID page field value), click ALFKI, and then click OK. Notice that employees 1 and 4 booked 2 orders each, while employees 3 and 6 booked 1 order each.
Understanding and Working with the XML Spreadsheet Schema
To provide the highest fidelity and the best XML data import experience with Excel 2002, Excel worksheets and workbooks can be exported as XML documents by using a special XML schema called the XML Spreadsheet schema (XMLSS). The XMLSS schema, invented by Microsoft primarily for use in Excel 2002, comprises a particular set of XML elements and attributes that represent, in plain text format, most of the formatting and other features of an Excel worksheet or workbook. The XMLSS schema is often used by software applications that automatically create text files formatted as rich Excel worksheets or by two organizations, only one of which uses Excel, that need to output annotated information from Excel workbooks in a plain text format without retouching the data.
| Note | For complete information on the XMLSS schema’s elements and attributes, see the article “XML Spreadsheet Reference” on the Microsoft Developer Network (MSDN) Web site at http:// msdn.microsoft.com. For additional information, see Microsoft Knowledge Base Article Q288215 “INFO: Microsoft Excel 2002 and XML” at http://support.microsoft.com/default.aspx?scid=KB;EN-US;Q288215&. |
To save the data in an Excel 2002 spreadsheet in the XMLSS schema format, select XML Spreadsheet in the Save As list when you save a file. You can open the XML file in Internet Explorer to examine the XMLSS schema output. To see how this works, open the ![]() Products.xml file in the Chap10 folder in Internet Explorer and in Excel. The different views of the file are shown in Figures 10-6 and 10-7.
Products.xml file in the Chap10 folder in Internet Explorer and in Excel. The different views of the file are shown in Figures 10-6 and 10-7.
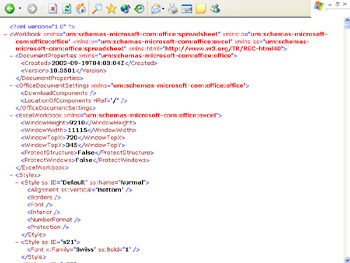
Figure 10-6: The Products.xml file displayed in Internet Explorer 6.
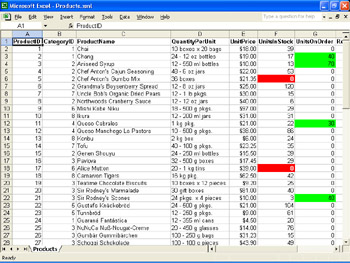
Figure 10-7: The Products.xml file displayed in Excel 2002.
First of all, notice that the XML data in Excel is very neat and clean. Element names don’t appear with slash symbols, as they do in flattened Excel XML data, and columns created by the flattening algorithm for attributes and summarizations are gone as well. Second, notice that the Excel version of the XML data contains bold column headers and several cells that are colored red or green. Excel formatting features are available for XML data that follows the XMLSS schema format. Third, you should notice in Internet Explorer that the XML contains a lot of additional XML data. For example, you can see several namespace declarations in the Workbook element, overall document settings in the DocumentProperties and OfficeDocumentSettings elements, formatting characteristics in the Styles element, and so on. The trade-off for enabling Excel features in XML data is that a lot of Excel-specific information must be included in the XML data. Excel uses this information when it loads the XML file to present and format the XML data. You could theoretically create a full-fidelity Excel spreadsheet, including the data and formatting, by using a text editor such as Notepad. In most business scenarios, however, an XML file that includes the Excel schema information would most likely be created by some type of automatic XML report-generation program.
| Note | Microsoft Excel 2002 can save XML files only in the XMLSS schema format. It cannot save workbooks in any other type of XML schema. |
By default, XML files are opened as read-only, leaving the original file unchanged for future use. When you open an XML file that references a style sheet, Excel gives you the opportunity to open the file without applying the style sheet, or to apply a specific stylesheet (if the file references more than one).
| Tip | You can also save the data from a Microsoft Office XP Spreadsheet Component in the XMLSS schema format. To do so, click the Export To Microsoft Excel button on the Spreadsheet Component’s toolbar. In the Save As list, select XML Spreadsheet. |
The following Excel information and features are not saved in worksheets or workbooks that are saved as XML data:
-
Charts, drawing layers, and other graphic objects
-
Custom views, outlining, and grouping
-
Data consolidation references and scenarios
-
Shared workbook information
-
User-defined function categories and Visual Basic for Applications projects
Note Data in password-protected worksheets and workbooks cannot be saved as XML.
Your Turn
In this exercise, you will see that using Excel data analysis features with flattened XML is the same as XMLSS schema formatted data. You will use an XMLSS schema formatted file to display only those rows from Category ID 1. You will also see how easy it is to display this XML data in a PivotTable report, as you did in the last exercise.
-
If you have not done so already, in Excel 2002, open the
Products.xml file in the Chap10 folder. -
On the Data menu, point to Filter and then click AutoFilter.
-
In cell B1, click the arrow, and click 1 in the list. Only rows for Category ID 1 are displayed, as shown in Figure 10-8.
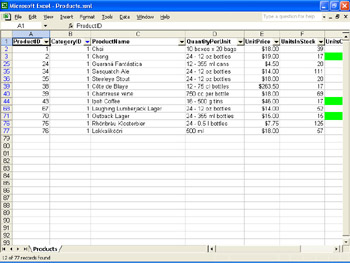
Figure 10-8: Products for category ID 1 only. -
On the Data menu, click PivotTable And PivotChart Report, and then click Finish.
-
Drag the CategoryID icon from the PivotTable field list to the Drop Page Fields Here area of the PivotTable report.
-
Drag the ProductName icon from the PivotTable Field List to the Drop Row Fields Here area of the PivotTable report.
-
Drag the UnitsInStock icon from the PivotTable Field List to the Drop Data Fields Here area of the PivotTable report.
-
Click the arrow in cell B1 (the CategoryID page field value), click 1, and click OK.
-
Click cell A4 (the ProductName field). On the PivotTable toolbar, click PivotTable, and then click Sort And Top 10.
-
Click the Descending option, click Sum Of UnitsInStock in the Using Field list underneath the Descending option, and then click OK. Notice that the Rh nbr u Klosterbier has the most units in stock.
Understanding and Working with XML Data in Excel Web Queries
You now know that Excel 2002 supports reading and writing XML. Additionally, Excel 2002 can create refreshable Web queries to live XML files.
To create an Excel Web query to an XML file, in an Excel workbook, point to Import External Data on the Data menu and then click New Web Query. In the Address box, type the address of the XML file, and then click Go. Click the Click To Select The Entire Page icon (the icon with an arrow). Click Import. Select either the Existing Worksheet option or the New Worksheet option. (With the Existing Worksheet option, the XML data will be imported starting with the cell listed in the box directly below the option’s label.) Finally, click OK. The XML data is imported into Excel as a Web query. You can now make changes to the original XML data file and reflect those changes in the Excel Web query by clicking Refresh Data on the Data menu in Excel.
Your Turn
In this exercise, you will create an Excel Web query to the ![]() Products.xml file, make a change to the
Products.xml file, make a change to the ![]() Products.xml file, and see the change in the Web query.
Products.xml file, and see the change in the Web query.
-
Start Excel.
-
On the Data menu, point to Import External Data and then click New Web Query.
-
In the Address box, type the address to the
Products.xml file in the Chap10 folder, and then click Go. The address will take the form something like file://c:/Microsoft Press/Excel Data Analysis/ Sample Files/Chap10/products.xml. -
Click the Click To Select The Entire Page icon (the icon with an arrow).
-
Compare your results to Figure 10-9, and then click Import.
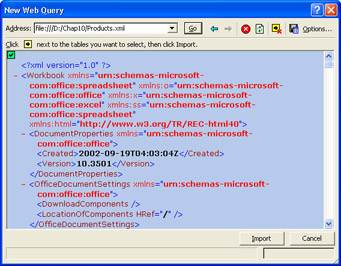
Figure 10-9: The completed New Web Query dialog box. -
Click the Existing Worksheet option, and then click OK. The XML data is imported into Excel as a Web query.
-
Using Notepad, open the
Products.xml file, change the single occurrence of the word ProductID to ProductNumber (use the Find command on the Edit menu to locate the text), and then save and close the file. -
Back in Excel, click Refresh Data on the Data menu. Notice that the text in cell A1 changes from ProductID to ProductNumber.
EAN: 2147483647
Pages: 137
- ERP Systems Impact on Organizations
- ERP System Acquisition: A Process Model and Results From an Austrian Survey
- The Second Wave ERP Market: An Australian Viewpoint
- A Hybrid Clustering Technique to Improve Patient Data Quality
- Relevance and Micro-Relevance for the Professional as Determinants of IT-Diffusion and IT-Use in Healthcare