Creating Custom Measures
You might have situations in which the measures that were defined in the original OLAP source data do not meet your business needs and the OLAP data source creator has not given you permissions to add measures to the original OLAP data source. For instance, you might not have the ability to add a measure to a read-only offline cube file, or your OLAP server administrator might not allow you to add a measure to the OLAP database on the server. In these situations, you can create a custom measure in Data Analyzer. The custom measure becomes part of the view file; it does not become part of either an offline cube file or an OLAP database on a server.
To create a custom measure in Data Analyzer, you use the Template Measure Editor, shown in Figure 9-17. To open the editor, click Add on the Template Measures tab of the Define View dialog box.
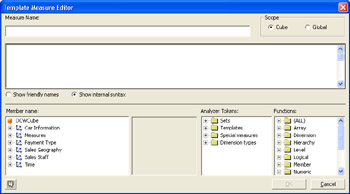
Figure 9-17: The Template Measure Editor.
In the Measure Name box, type a name that is easy for you to remember. In most cases you’ll want to select the Show Internal Syntax option. The Show Friendly Names option hides the details of the underlying syntax that Data Analyzer uses to build custom measures. However, clicking the Show Friendly Names option prevents you from editing these expressions, which you need to do with practically all custom measures.
Multidimensional Expressions
The language used to construct custom measures in Data Analyzer is the Multidimensional Expressions (MDX) language. MDX syntax provides the means for retrieving and working with data stored in a cube. A few of the more frequently used MDX functions include
-
The Dimension function, which returns the dimension that contains a specified member, level, or hierarchy.
-
The Level function, which returns the level of a specified member.
-
The IsLeaf function, which determines whether a specified member is a leaf member.
-
The Avg, Max, Median, and Min functions, which return the average, maximum, midpoint, and minimum data values over a group of members.
For more in-depth information about how to use the various functions in the Template Measure Editor and MDX statements, consult the MDX Function Reference in the MSDN Library, located at http:// msdn.microsoft.com/library/en-us/olapdmad/agmdxfunctintro_6n5f.asp. You can also consult the MDX Function List in SQL Server Books Online at http://www.microsoft.com/sql/techinfo/productdoc/2000/books.asp.
For the Scope option, Cube is selected by default. With cube scope, a custom measure applies only to the current cube. Selecting the global scope option makes a custom measure available to all cubes viewed in Data Analyzer. You can create measures with either cube scope or global scope and run them against any cube, but if the custom measure doesn’t make sense for a particular cube, Data Analyzer returns an error.
Construct the custom measure by dragging dimensions, members, tokens (which are shorthand versions of more advanced measures or member groups), and functions listed in the lower half of the dialog box to the expression box below the Measure Name box. To get a brief description of the functions in the Template Measure Editor’s Functions list, you can rest your mouse pointer on any function in the list.
To add a measure you’ve defined to a view, you use the Measures tab of the Define View dialog box. If the Display Type list is set to Grid, check the box containing the name of the new custom measure. If the Display Type list is set to Bars, select the name of the new custom measure in either the Length or Color list, depending on whether you want the bar lengths or colors to represent the new custom measure.
Your Turn
In this exercise, you will create a custom measure that changes the lengths of the bars and the sizes of the pie slices in the ![]() CarSales.max view file to represent a 5 percent sales commission instead of total sales.
CarSales.max view file to represent a 5 percent sales commission instead of total sales.
-
With the
 CarSales.max file open, click Change View on the Edit menu.
 -
Click the Template Measures tab, and then click Add.
-
In the Measure Name box, type Sales Commission.
-
In the Member Name list, click the plus sign (+) next to the Measures icon, click the plus sign next to the MeasuresLevel icon, and then drag the Sum Of Price icon to the expression box.
-
In the expression box, following the text [Measures].[Sum Of Price], type * 0.05. Compare your results to Figure 9-18, and then click OK.
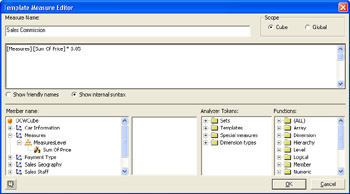
Figure 9-18: The Sales Commission custom measure definition. -
Click the Measures tab, select Sales Commission in the Length list, click OK, and compare your results to Figure 9-19. Rest your mouse pointer on any member bar to confirm that the bar lengths or pie-slice sizes now represent sales commission figures.
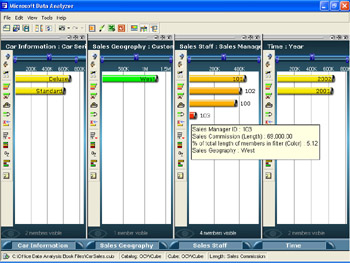
Figure 9-19: The bar lengths reflect the Sales Commission measure. -
Switch the bar lengths and pie-slice sizes back to their original measures: on the Edit menu, click Change View, click the Measures tab, select Sum Of Price in the Length list, and then click OK. Compare your results to Figure 9-20.
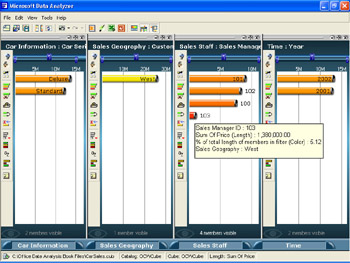
Figure 9-20: The bar lengths reflect the Sum of Price measure.
Here are a few additional custom measures that you can try in conjunction with the ![]() CarSales.max view file. To try these out, follow the steps in the previous Your Turn exercise and type the following expressions into the expression box below the Measure Name box. To learn more about how these expressions work, click the Show Names option after you type the expression into the expression box.
CarSales.max view file. To try these out, follow the steps in the previous Your Turn exercise and type the following expressions into the expression box below the Measure Name box. To learn more about how these expressions work, click the Show Names option after you type the expression into the expression box.
-
Average Car Sales (the average of car sales for all of the visible members in a dimension pane): Avg(~Set:$$CurrentAspect:Selected~, [Measures].[Sum Of Price]). See Figures 9-21 and 9-22.
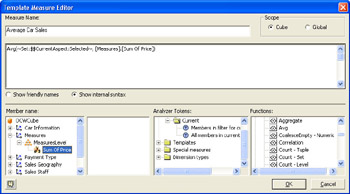
Figure 9-21: The definition of the Average Car Sales custom measure.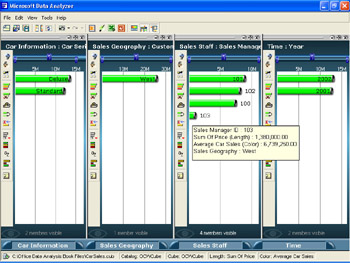
Figure 9-22: The Average Car Sales custom measure applied to the current view’s colors. You can easily see that sales manager 103’s sales were well below average. -
Percent of Highest Car Sales Member (assuming that the members’ lengths represent the Sum of Price measure, this measure is the ratio of the current member to the member with the longest length in the dimension pane): ~Trait:Core.Length~ / Max(~Set:$$CurrentAspect:Selected~, [Measures].[Sum Of Price]). See Figures 9-23 and 9-24.
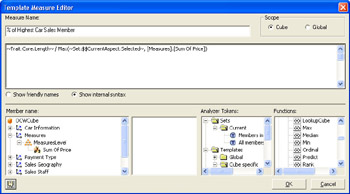
Figure 9-23: The definition of the Percent of Highest Car Sales Member custom measure.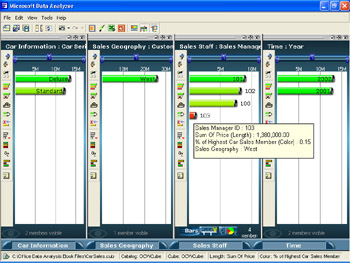
Figure 9-24: Percent of Highest Car Sales Member custom measure applied to the current view’s colors.
EAN: 2147483647
Pages: 137