Connecting to OLAP Data
To connect to and display OLAP data in Microsoft Data Analyzer, you must first create a view file, which is a special text file with the extension .max. The view file itself does not include any data from the OLAP data source. Rather, it contains details about the OLAP data source connection and about how to initially display the data in Data Analyzer. You create one view file for each way in which you want to initially view a particular OLAP data source in Data Analyzer. For instance, you would create one view file to connect to a specific offline cube file and display a dimension’s data initially as bars; you would create a different view file to connect to the same offline cube file and display the dimension’s data initially as a pie chart.
| Note | You can also distribute a view file to other Data Analyzer users, provided the users have access to the associated OLAP data source. The view file contains information to connect to the data source; if other users cannot access the target OLAP data source with an application such as Excel, they won’t be able to use Data Analyzer to access the target OLAP data source either. |
To create a view file in Data Analyzer, click New on the File menu. Click Next and then click Add. You’ll see the Connection Properties dialog box, shown in Figure 9-3.
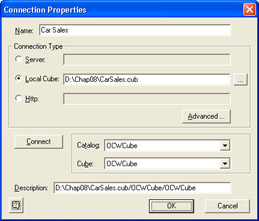
Figure 9-3: The Connection Properties dialog box.
In the Name box, type a descriptive name for the view, one that is easy for you to remember. In the Connection Type area, do one of the following:
-
Click the Server option and type an OLAP server name if the OLAP data is stored on a Microsoft SQL Server 2000 Analysis Services server computer.
-
Click the Local Cube option and type the full path to an offline cube file if the OLAP data is stored in an offline cube file.
-
Click the HTTP option and type the Web address if the OLAP data is stored on a Microsoft SQL Server 2000 Analysis Services server computer available over the Internet. Click the Advanced button if you need to provide additional connection details such as a logon name (if the Web server requires one to access the OLAP data).
Click the Connect button to connect to the OLAP data. Select the OLAP catalog name in the Catalog list, and then select the OLAP cube name in the Cube list. Click OK to close the Connection Properties dialog box, and then click Next. Select the check box for each dimension that you want to display in a dimension pane in Data Analyzer.
Click Next. In the Display Type list, select Bars if you want to initially display member bars or select Grid if you want to initially display details in a grid. If you select Bars, in the Length list, select a measure that the bar lengths and pie-slice sizes will represent. In the Color list, select a ratio or percentage that the bar and pie-slice colors will represent. If you select Grid, select the measures as well as any ratios or percentages you want to appear in the grids and bar and pie-slice information tips.
| Tip | If you forget to select a particular check box in the Define View— Dimensions page or you select the wrong choice in the Display Type, Length, or Color lists in the Define View—Measures page, you can modify your choices later after the view file is created. |
Click Finish. The view file is created, Data Analyzer connects to the source data, and the data view is displayed according to the options that you specified.
Your Turn
In this exercise, you will create a Data Analyzer view based on the ![]() CarSales.cub offline cube file used in Chapter 8. You will also practice opening an existing view file in Data Analyzer.
CarSales.cub offline cube file used in Chapter 8. You will also practice opening an existing view file in Data Analyzer.
-
Start Data Analyzer. If the Microsoft Data Analyzer Startup dialog box appears, click Cancel to close it.
-
On the File menu, click New.
-
If the Define View–Introduction page appears, click Next.
-
Click Add.
-
In the Name box, type Car Sales.
-
Click the Local Cube option, and then click the browse button (the button with the three dots on it).
-
Locate and select the
 CarSales.cub file located in the Chap08 folder, and then click Open.
 -
Click Connect, click OK, and then click Next.
-
Select the Car Information, Sales Geography, Sales Staff, and Time check boxes, and then click Next.
-
Keep the Display Type and Length settings as is. In the Color list, select % Of Total Length Of Members In Filter, and then click Finish. Compare your results to Figure 9-4.
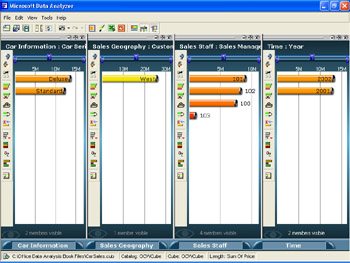
Figure 9-4: Initial view based on the Car Sales cube. -
On the File menu, click Save As.
-
In the File Name box, type CarSales, and then click Save.
-
On the File menu, click Close.
-
To open the view file, on the File menu, click Open, locate and select the
CarSales.max file, and then click Open.
EAN: 2147483647
Pages: 137