Querying Data
Queries allow you to enhance data filtering actions. Queries are more powerful than filters because queries not only select data, but they also use more advanced filter criteria and expressions; provide a crosstab view of data (similar to a PivotTable); create new data tables; and update, append, and delete data in existing data tables. You can design and run several different types of queries in Access.
-
A select query, as its name implies, selects data from one or more data tables. The results of a select query are stored in temporary computer memory only until the query is closed. Select queries can be saved and used as the basis for data-entry forms and reports.
-
A crosstab query summarizes data from one or more data tables. The results of a crosstab query look similar to a PivotTable report; however, crosstab queries cannot be pivoted. Similar to a select query, the results of a crosstab query are stored in temporary computer memory only until the query is closed. A crosstab query can be saved if you want to review that set of results regularly.
-
A make-table query creates a new data table and places the results of the query as records in the table. The original data is unaffected and is not linked to the new data table.
-
An update query modifies data in a data table with the results of the query.
-
An append query adds the results of the query to a data table as new records.
-
A delete query deletes data from an existing data table.
For data analysis purposes, you will most frequently use a select or crosstab query. I’ll cover these types of queries in more detail in this section. For information about the other query types, see Microsoft Access Help or the book Microsoft Access Version 2002 Inside Out (Microsoft Press, 2002).
To create and run a select query, first click Query on the Insert menu. In the list, click Design View and then click OK. Fill in the grid with one or more query conditions. On the Query menu, click Run to see the query results.
Your Turn
In this exercise, you will display all sales orders booked by employee Steven Buchanan in the month of January 1998, and that were shipped via United Package.
-
If the
 Northwind.mdb file is not already open, start Access and open the Northwind.mdb file in the Chap05 folder.
 -
On the Insert menu, click Query.
-
Click OK.
-
Above the query grid, right-click any visible table and click Remove Table.
-
On the Query menu, click Show Table.
-
Click Orders, and then click Add.
-
Click Employees, and then click Add again.
-
Click Shippers, and then click Add again.
-
Click Close in the Show Table dialog box.
-
In the grid’s first column, click the Field cell, click the arrow, and select Orders.* from the list.
-
In the grid’s second column, click the Field cell, click the arrow, and select Employees.LastName from the list.
-
Clear the Show check box.
-
Click the Criteria cell, type “Buchanan”, and then press Enter.
-
In the grid’s third column, click the Field cell, click the arrow, and select Employees.FirstName from the list.
-
Clear the Show check box.
-
Click the Criteria cell, type “Steven”, and then press Enter.
-
In the grid’s fourth column, click the Field cell, click the arrow, and then select Orders.OrderDate from the list.
-
Clear the Show check box.
-
Click the Criteria cell, type Between #01/01/1998# And #01/31/ 1998#, and then press Enter.
-
In the grid’s fifth column, click the Field cell, click the arrow, and select Shippers.CompanyName from the list.
-
Clear the Show check box.
-
Click the Criteria cell, type “United Package”, and then press Enter. Now compare your results to Figure 5-11.
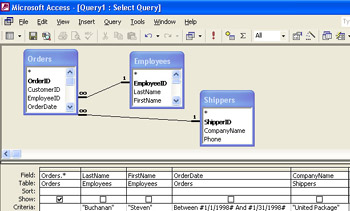
Figure 5-11: Designing the select query. -
On the Query menu, click Run. Compare your results to Figure 5-12. Two orders were booked by Steven Buchanan during January 1998 and shipped via United Package.

Figure 5-12: Orders booked by Steven Buchanan during the month of January 1998 and shipped via United Package.
Crosstab queries are ideal for summarizing larger amounts of data than select queries. Select queries usually present all of the matching data records, whereas crosstab queries use rows and columns, similar to PivotTable reports, to summarize data. Generally, you use crosstab queries instead of select queries to calculate and restructure data for easier data analysis. Crosstab queries calculate a sum, average, count, or other type of total for data that is grouped by two types of information that you specify—one down the left side and another across the top.
To create and run a crosstab query by using a wizard, click Query on the Insert menu, click Crosstab Query Wizard, and then click OK. In the Which Table Or Query Contains The Fields You Want For The Cross Tab Query Results list, click a table or query containing the fields that you want to display in the crosstab report. Specify the fields that you want displayed in the crosstab report’s rows and columns, and specify a summarization type. Specify a name for the crosstab query, click Finish, and the crosstab report is displayed.
Your Turn
In this exercise, you will create a crosstab report showing total order invoice amounts for all customers for the years 1996 to 1998.
-
If the
Northwind.mdb file is not already open, start Access and open Northwind.mdb in the Chap05 folder. -
On the Insert menu, click Query.
-
Click Crosstab Query Wizard, and then click OK.
-
Click the Queries option, click Query: Invoices, and then click Next.
-
Double-click Customers.CompanyName to add this field as a row heading, and then click Next.
-
Click Order Date to use this field as a column heading, and then click Next.
-
Click Year as the grouping interval, and then click Next.
-
In the Fields list, click Extended Price. This is the data that will be summarized. In the Functions list, click Sum, and then click Next.
-
Click Finish, and compare your results to Figure 5-13.
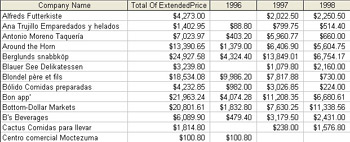
Figure 5-13: Crosstab report displaying total order invoice amounts for all customers for the years 1996 to 1998.
EAN: 2147483647
Pages: 137