Section 13.4. Tracing and Profiling Tools
13.4. Tracing and Profiling ToolsMany useful tools can provide you with various views of the system. Some tools offer a high-level perspective, such as what processes are running on your system and which processes are consuming the most CPU bandwidth. Other tools can provide detailed analysis, such as where memory is being allocated or, even more useful, where it is being leaked. The next few sections introduce the most important tools and utilities in this category. We have space for only a cursory introduction to these tools; references are provided where appropriate if you want more details. 13.4.1. straceThis useful system trace utility is found in virtually all Linux distributions. strace captures and displays useful information for every kernel system call executed by a Linux application program. strace is especially handy because it can be run on programs for which no source code is available. It is not necessary to compile the program with debug symbols as it is with GDB. Furthermore, strace can be a very insightful educational tool. As the man page states, "Students, hackers and the overly-curious will find that a great deal can be learned about a system and its system calls by tracing even ordinary programs." While preparing the example software for the GDB section earlier in this chapter, I decided to use a software project unfamiliar to me, an early version of the GoAhead web server. The first attempt at compiling and linking the project led to an interesting example for strace. Starting the application from the command line silently returned control back to the console. No error messages were produced, and a look into the system logs also produced no clues! It simply would not run. strace quickly identified the problem. The output from invoking strace on this software package is produced in Listing 13-5. Many lines from this output have been deleted due to space considerations. The unedited output is over one hundred lines long. Listing 13-5. [4]strace Output: GoAhead Web Demo
Line numbers have been added to the output produced by strace to make this listing more readable. Invocation of the command is found on line number 01. In its simplest form, simply add the strace command directly in front of the program you want to examine. This is how the output in Listing 13-5 was produced. Each line of this trace represents the websdemo process making a system call into the kernel. We don't need to analyze and understand each line of the trace, although it is quite instructive to do so. We are looking for any anomalies that might help pinpoint why the program won't run. In the first several lines, Linux is setting up the environment in which the program will execute. We see several open() system calls to /etc/ld.so.*, which are the Linux dynamic linker-loader (ld.so) doing its job. In fact, line 06 was my clue that this example embedded board had not been properly configured. There should be a linker cache produced by running ldconfig. (The linker cache substantially speeds up searching for shared library references.) This was subsequently resolved by running ldconfig on the target. Down through line 19 is more basic housekeeping, mostly by the loader and libc initializing. Notice in line 20 that the program is looking for a configuration file but did not find one. That could be an important issue when we get the software running. Starting with line 24, the program begins to set up and configure the appropriate networking resources that it needs. Lines 24 through 29 open and read a Linux system file containing instructions for the DNS service to resolve hostnames. Local network configuration activity continues through line 81. Most of this activity consists of network setup and configuration necessary to build the networking infrastructure for the program itself. This portion of the listing has been removed for brevity and clarity. Notice especially the network activity starting with line 82. Here we have the program trying to establish a TCP/IP connection to an IP address of all zeros. Line 82 is reproduced here for convenience: socket(PF_INET, SOCK_DGRAM, IPPROTO_IP) = 3 A couple points about Listing 13-5 are worth noting. We might not know all the details of every system call, but we can get a general idea of what is happening. The socket() system call is similar to a file system open() call. The return value, indicated by the = sign, in this case, represents a Linux file descriptor. Knowing this, we can associate the activity from line 82 through the close() system call in line 89 with file descriptor 3. We are interested in this group of related system calls because we see an error message in line 88: "Connection refused." At this point, we still don't know why the program won't run, but this appears abnormal. Let's investigate. Line 82, the system call to socket(), establishes an endpoint for IP communication. Line 83 is quite curious because it tries to establish a connection to a remote endpoint (socket) containing an IP address of all zeros. We don't have to be network experts to suspect that this might be causing trouble.[5] Line 83 provides another important clue: The port parameter is set to 53. A quick Google search for TCP/IP port numbers reveals that port 53 is the Domain Name Service, or DNS.
Line 84 provides yet another clue. Our board has a hostname of coyote. This can be seen as part of the command prompt in line 01 of Listing 13-5. It appears that this activity is a DNS lookup for our board's hostname, which is failing. As an experiment, we add an entry in our target system's /etc/hosts[6] file to associate our locally defined hostname with the board's IP locally assigned IP address, as follows:
Coyote 192.168.1.21 #The IP address we assigned Voilà: Our program begins to function normally. Although we might not know exactly why this would lead to a program failure (TCP/IP networking experts might), our strace output led us to the fact that a DNS lookup for our board name was failing. When we corrected that, the program started up happily and began serving web pages. To recap, this was a program for which we had no source code to reference, and it had no symbols compiled into its binary image. Using strace, we were able to determine the cause of the program failure, and implement a solution. 13.4.2. strace VariationsThe strace utility has many command line options. One of the more useful includes the capability to select a subset of system calls for tracing. For example, if you want to see only the network-related activity of a given process, issue the command as follows: $ strace -e trace=network process_nameThis produces a trace of all the network-related system calls, such as socket(), connect(), recvfrom(), and send(). This is a powerful way to view the network activity of a given program. Several other subsets are available. For example, you can view only the file-related activities of a program, with open(), close(), read(), write(), and so on. Additional subsets include process-related system calls, signal-related system calls, and IPC-related system calls. It is worth noting that strace is capable of dealing with tracing programs that spawn additional processes. Invoking strace with the -f option instructs strace to follow child processes that are created using the fork() system call. Numerous possibilities exist with the strace command. The best way to become proficient with this powerful utility is to use it. Make it a point with this and all the tools we present to seek out and read the latest open-source documentation. In this case, man strace on most Linux hosts will produce enough material to keep you experimenting for an afternoon! One very useful way to employ strace is using the -c option. This option produces a high-level profiling of your application. Using the -c option, strace accumulates statistics on each system call, how many times it was encountered, how many times errors were returned, and the time spent in each system call. Listing 13-6 is an example of running strace -c on the webs demo from the previous example. Listing 13-6. Profiling Using strace
This is a very useful way to get a high-level view of where your application is consuming time and where errors are occurring. Some errors might be a normal part of your application's operation, but others might be consuming time that you hadn't intended. From Listing 13-6, we can see that the syscall with the longest duration was the execve(), which is the call that the shell used to spawn the application. As you can see, it was called only once. Another interesting observation is that the send() system call was the most frequently used syscall. This makes sensethe application is a small web server. Bear in mind that, like the other tools we have been discussing here, strace must be compiled for your target architecture. strace is executed on your target board, not your development host. You must use a version that is compatible with your architecture. If you purchase a commercial embedded Linux distribution, you should make sure that this utility is included for your chosen architecture. 13.4.3. ltraceThe ltrace and strace utilities are closely related. The ltrace utility does for library calls what strace does for system calls. It is invoked in a similar fashion: Precede the program to be traced by the tracer utility, as follows: $ ltrace ./exampleListing 13-7 reproduces the output of ltrace on a small example program that executes a handful of standard C library calls. Listing 13-7. Example ltrace Output
For each library call, the name of the call is displayed, along with varying portions of the parameters to the call. Similar to strace, the return value of the library call is then displayed. As with strace, this tool can be used on programs for which source code is not available. As with strace, a variety of switches affect the behavior of ltrace. You can display the value of the program counter at each library call, which can be helpful in understanding your application's program flow. As with strace, you can use -c to accumulate and report count, error, and time statistics, making a useful simple profiling tool. Listing 13-8 displays the results of our simple example program using the -c option. Listing 13-8. Profiling Using ltrace
The ltrace tool is available only for programs that have been compiled to use dynamically linked shared library objects. This is the usual default, so unless you explicitly specify -static when compiling, you can use ltrace on the resulting binary. Again similar to strace, you must use an ltrace binary that has been compiled for your target architecture. These utilities are run on the target, not the host development system. 13.4.4. psWith the possible exception of strace and ltrace, no tools are more often neglected by the embedded systems developer than top and ps. Given the myriad options available for each utility, we could easily devote an entire chapter to these useful system-profiling tools. They are almost universally available in embedded Linux distributions. Both of these utilities make use of the /proc file system, as described in Chapter 9, "File Systems." Much of the information they convey can be learned from the /proc file system if you know what to look for and how to parse the resulting information. These tools present that information in a convenient human-readable form. The ps utility lists all the running processes on a machine. However, it is very flexible and can be tailored to provide much useful data on the state of a running machine and the processes running on it. For example, ps can display the scheduling policy of each process. This is particularly useful for systems that employ real-time processes. Without any options, ps displays all processes with the same user ID as the user who invoked the command, and only those processes associated with the terminal on which the command was issued. This is useful when many jobs have been spawned by that user and terminal. Passing options to ps can be confusing because ps supports a wide variety of standards (as in POSIX versus UNIX) and three distinct options styles: BSD, UNIX, and GNU. In general, BSD options are single or multiple letters, with no dash. UNIX options are the familiar dash-letter combinations, and GNU uses long argument formats preceded by double dashes. Refer to the man page for details of your ps implementation. Everyone who uses ps likely has a favorite invocation. One particularly useful general-purpose invocation is ps aux. This displays every process on the system. Listing 13-9 is an example from a running embedded target board. Listing 13-9. Process Listing
This is but one of the many ways to view output data using ps. The columns are explained in the following text.
Most of the processes in this example are not associated with a controlling terminal. The ps command that generated Listing 13-9 was issued from a Telnet session, which is indicated by the pts/0 terminal device. The STAT field describes the state of the process at the time this snapshot was produced. Here, S means that the process is sleeping, waiting on an event of some type, often I/O. R means that the process is in a runnable state (that is, the scheduler is free to give it control of the CPU if nothing of a higher priority is waiting). The left bracket next to the state letter is an indication that this process has a higher priority. The final column is the command name. Those listed in brackets are kernel threads. Many more symbols and options are available; refer to the man page for ps for complete details. 13.4.5. topWhereas ps is a one-time snapshot of the current system, top takes periodic snapshots of the state of the system and its processes. Similar to ps, top has numerous command line and configuration options. It is interactive and can be reconfigured while operating to customize the display to your particular needs. Entered without options, top displays all running processes in a fashion very similar to the ps aux command presented in Listing 13-9, updated every 3 seconds. Of course, this and many other aspects of top are user configurable. The first few lines of the top screen display system information, also updated every 3 seconds. This includes the system uptime, the number of users, information on the number of processes and their state, and much more. Listing 13-10 shows top in its default configuration, resulting from executing top from the command line without parameters. Listing 13-10. top
The default columns from Listing 13-10 are the PID, the user, the process priority, the process nice value, the virtual memory used by the process, the resident memory footprint, the amount of shared memory used by the task, and other fields that are identical to those described in the previous ps example. Space permits only a cursory introduction to these useful utilities. You are encouraged to spend an afternoon with the man pages for top and ps to explore the richness of their capabilities. 13.4.6. mtraceThe mtrace package is a simple utility that analyzes and reports on calls to malloc(), realloc(), and free() in your application. It is easy to use and can potentially help spot trouble in your application. As with other userland tools we have been describing in this chapter, you must have the mtrace package configured and compiled for your architecture. mtrace is a malloc replacement library that is installed on your target. Your application enables it with a special function call. Your embedded Linux distribution should contain the mtrace package. To demonstrate this utility, we created a simple program that creates dynamic data on a simple linked list. Each list item was dynamically generated, as was each data item we placed on the list. Listing 13-11 reproduces the simple list structure. Listing 13-11. Simple Linear Linked List
Each list item was dynamically created using malloc() as follows and subsequently placed at the end of the linked list: struct blist_s *p = malloc( sizeof(struct blist_s) ); Each variable-sized data item in the list was also dynamically generated and added to the list item before being placed at the end of the list. This way, every list item was created using two calls to malloc(), one for the list item itself, represented by struct blist_s just shown, and one for the variable data item. We then generated 10,000 records on the list containing variable string data, resulting in 20,000 calls to malloc(). To use mtrace, tHRee conditions must be satisfied:
When these conditions are satisfied, each call to one of the traced functions generates a line in the raw trace file defined by MALLOC_TRACE. The trace data looks like this: @ ./mt_ex:[0x80486ec] + 0x804a5f8 0x10 The @ sign signals that the trace line contains an address or function name. In the previous example, the program was executing at the address in square brackets, 0x80486ec. Using binary utilities or a debugger, we could easily associate this address with a function. The plus sign (+) indicates that this is a call to allocate memory. A call to free() would be indicated by a minus sign. The next field indicates the virtual address of the memory location being allocated or freed. The last field is the size, which is included in every call to allocate memory. This data format is not very user friendly. For this reason, the mtrace package includes a utility[7] that analyzes the raw trace data and reports on any inconsistencies. In the simplest case, the Perl script simply prints a single line with the message "No memory leaks". Listing 13-12 contains the output when memory leaks are detected.
Listing 13-12. mtrace Error Report
As you can see, this simple tool can help you spot trouble before it happens, as well as find it when it does. Notice that the Perl script has displayed the filename and line number of each call to malloc() that does not have a corresponding call to free() for the given memory location . This requires debugging information in the executable file generated by passing the -g flag to the compiler. If no debugging information is found, the script simply reports the address of the function calling malloc(). 13.4.7. dmallocdmalloc picks up where mTRace leaves off. The mtrace package is a simple, relatively nonintrusive package most useful for simple detection of malloc/free unbalance conditions. The dmalloc package enables the detection of a much wider range of dynamic memory-management errors. Compared to mTRace, dmalloc is highly intrusive. Depending on the configuration, dmalloc can slow your application to a crawl. It is definitely not the right tool if you suspect memory errors due to race conditions or other timing issues. dmalloc (and mtrace, to a lesser extent) will definitely change the timing of your application. dmalloc is a very powerful dynamic memory-analysis tool. It is highly configurable and, therefore, somewhat complex. It takes some time to learn and master this tool. However, from QA testing to bug squashing, it could become one of your favorite development tools. dmalloc is a debug malloc library replacement. These conditions must be satisfied to use dmalloc:
Although it is not strictly necessary, you should include dmalloc.h in your application program. This allows dmalloc to include file and line number information in the output. Link your application against the dmalloc library of your choice. The dmalloc package can be configured to generate several different libraries, depending on your selections during package configuration. In the examples to follow, we have chosen to use the libdmalloc.so shared library object. Place the library (or a symlink to it) in a path where your compiler can find it. The command to compile your application might look something like this: $ ppc_82xx-gcc -g -Wall -o mtest_ex -L../dmalloc-5.4.2/ \ -ldmalloc mtest_ex.cThis command line assumes that you've placed the dmalloc library (libdmalloc.so) in a location searched by the -L switch on the command linenamely, the ../dmalloc-5.4.2 directly just above the current directory. To install the dmalloc library on your target, place it in your favorite location (perhaps /usr/local/lib). You might need to configure your system to find this library. On our example PowerPC system, we added the path /usr/local/lib to the /etc/ld.so.conf file and invoked the ldconfig utility to update the library search cache. The last step in preparation is to set an environment variable that the dmalloc library uses to determine the level of debugging that will be enabled. The environment variable contains a debug bit mask that concatenates a number of features into a single convenient variable. Yours might look something like this: DMALLOC_OPTIONS=debug=0x4f4ed03,inter=100,log=dmalloc.log Here, debug is the debug-level bit mask, and inter sets an interval count at which the dmalloc library performs extensive checks on itself and the heap. The dmalloc library writes its log output to the file indicated by the log variable. The dmalloc package comes with a utility to generate the DMALLOC_OPTIONS environment variable based on flags passed to it. The previous example was generated with the following dmalloc invocation. The documentation in the dmalloc package details this quite thoroughly, so we shall not reproduce that here. $ dmalloc -p check-fence -l dmalloc.log -i 100 highWhen these steps are complete, you should be able to run your application against the dmalloc debug library. dmalloc produces a quite detailed output log. Listing 13-13 reproduces a sample dmalloc log output for an example program that intentionally generates some memory leaks. Listing 13-13. dmalloc Log Output
It is important to note that this log is generated upon program exit. (dmalloc has many options and modes of operation; it is possible to configure dmalloc to print output lines when errors are detected.) The first half of the output log reports high-level statistics about the heap and the overall memory usage of the application. Totals are produced for each of the malloc library calls, such as malloc(), free(), and realloc(). Interestingly, this default log reports on the top 10 allocations and the source location where they occurred. This can be very useful for overall system-level profiling. Toward the end of the log, we see evidence of memory leaks in our application. You can see that the dmalloc library detected four instances of memory that was allocated that was apparently never freed. Because we included dmalloc.h and compiled with debug symbols, the source location where the memory was allocated is indicated in the log. As with the other tools we've covered in this chapter, space permits only a brief introduction of this very powerful debug tool. dmalloc can detect many other conditions and limits. For example, dmalloc can detect when a freed pointer has been written. It can tell whether a pointer was used to access data outside its bounds but within the application's permissible address range. In fact, dmalloc can be configured to log almost any memory transaction through the malloc family of calls. dmalloc is a tool that is sure to pay back many times the effort taken to become proficient with it. 13.4.8. Kernel OopsAlthough not strictly a tool, a kernel oops contains much useful information to help you troubleshoot the cause. A kernel oops results from a variety of kernel errors from simple memory errors produced by a process (fully recoverable, in most cases) to a hard kernel panic. Recent Linux kernels support display of symbolic information in addition to the raw hexadecimal address values. Listing 13-14 reproduces a kernel oops from a PowerPC target. Listing 13-14. Kernel Oops
Notice that the register dump includes symbolic information, where appropriate. Your kernel must have KALLSYSMS enabled for this symbolic information to be available. Figure 13-4 shows the configuration options under the General Setup main menu. Figure 13-4. Symbol support for oops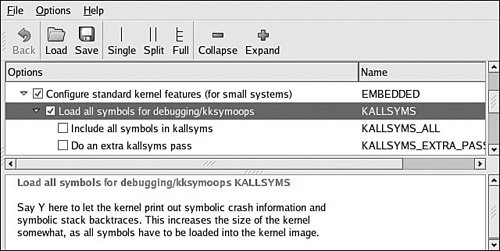 Much of the information in a kernel oops message is directly related to the processor. Having some knowledge of the underlying architecture is necessary to fully understand the oops message. Analyzing the oops in Listing 13-14, we see right away that the oops was generated due to a "kernel access of bad area, sig: 11". We already know from previous examples in this chapter that signal 11 is a segmentation fault. The first section is a summary showing the reason for the oops, a few important pointers, and the offending task. In Listing 13-14, NIP is the next instruction pointer, which is decoded later in the oops message. This points to the offending code that led to the oops. LR is a PowerPC register and usually indicates the return address for the currently executing subroutine. SP is the stack pointer. REGS indicates the kernel address for the data structure containing the register dump data, and TRAP indicates the type of exception that this oops message relates to. Referring to the PowerPC architecture reference manual referenced at the end of Chapter 7, "Bootloaders," we see that a TRAP 0300 is the PowerPC Data Storage Interrupt, which is triggered by a data memory access error. On the third line of the oops message, we see additional PowerPC machine registers, such as MSR (machine state register) and a decode of some of its bits. On the next line, we see the DAR (data access register), which often contains the offending memory address. The DSISR register contents can be used in conjunction with the PowerPC architecture reference to discover much detail about the specific reason for the exception. An oops message also contains the task pointer and the decoded task name to quickly determine what task or thread was running at the time of the oops. We also see a detailed processor register dump, which can be used for additional clues. Again, we need knowledge of the architecture and compiler register usage to make sense of the clues from the register values. For example, the PowerPC architecture uses the r3 register for return values from C functions. The last part of the oops message provides a stack backtrace with symbol decode if symbols are enabled in the kernel. Using this information, we can construct a sequence of events that led to the offending condition. In this simple example, we have learned a great deal of information from this oops message. We know that it was a PowerPC Data Storage Exception, caused by an error in a data memory access (as opposed to an instruction fetch memory access). The DAR register tells us that the data address that generated this exception was 0x0000_0000. We know that the modprobe process produced the error. From the backtrace and NIP (next instruction pointer), we know that it was in a call to strcpy() that can be traced directly back to the loop_init() function in the loop.ko module, which modprobe was trying to insert at the time of the exception. Given this information, tracking down the source of this errant null pointer dereference should be quite trivial. |
EAN: 2147483647
Pages: 167