Section 17.4. Debugging the Real-Time Kernel
17.4. Debugging the Real-Time KernelSeveral configuration options facilitate debugging and performance analysis of the real-time patched kernel. They are detailed in the following subsections. 17.4.1. Soft Lockup DetectionTo enable soft lockup detection, enable CONFIG_DETECT_SOFTLOCKUP in the kernel configuration. This feature enables the detection of long periods of running in kernel mode without a context switch. This feature exists in non-real-time kernels but is useful for detecting very high latency paths or soft deadlock conditions. To use it, simply enable the feature and watch for any reports on the console or system log. Reports will be emitted similar to this: BUG: soft lockup detected on CPU0 When this message is emitted by the kernel, it is usually accompanied by a backtrace and other information such as the process name and PID. It will look similar to a kernel oops message complete with processor registers. See .../kernel/softlockup.c for details. This information can be used to help track down the source of the lockup condition. 17.4.2. Preemption DebuggingTo enable preemption debugging, enable CONFIG_DEBUG_PREEMPT in the kernel configuration. This debug feature enables the detection of unsafe use of preemption semantics such as preemption count underflows and attempts to sleep while in an invalid context. To use it, simply enable the feature and watch for any reports on the console or system log. Here is just a small sample of reports possible when preemption debugging is enabled: BUG: <me> <mypid>, possible wake_up race on <proc> <pid> BUG: lock recursion deadlock detected! <more info> BUG: nonzero lock count <n> at exit time? Many more messages are possiblethese are just a few examples of the kinds of problems that can be detected. These messages will help you avoid deadlocks and other erroneous or dangerous programming semantics when using real-time kernel features. For more details on the messages and conditions under which they are emitted, browse the Linux kernel source file .../kernel/rt-debug.c. 17.4.3. Debug Wakeup TimingTo enable wakeup timing, enable CONFIG_WAKEUP_TIMING in the kernel configuration. This debug option enables measurement of the time taken from waking up a high-priority process to when it is scheduled on a CPU. Using it is simple. When configured, measurement is disabled. To enable the measurement, do the following as root: # echo '0' >/proc/sys/kernel/preempt_max_latencyWhen this /proc file is set to zero, each successive maximum wakeup timing result is written to this file. To read the current maximum, simply display the value: # cat /proc/sys/kernel/preempt_max_latency 84As long as any of the latency-measurement modes are enabled in the kernel configuration, preempt_max_latency will always be updated with the maximum latency value. It cannot be disabled. Writing 0 to this /proc variable simply resets the maximum to zero to restart the cumulative measurement. 17.4.4. Wakeup Latency HistoryTo enable wakeup latency history, enable CONFIG_WAKEUP_LATENCY_HIST while CONFIG_WAKEUP_TIMING is also enabled. This option dumps all the wakeup timing measurements enabled by CONFIG_WAKEUP_TIMING into a file for later analysis. An example of this file and its contents is presented shortly when we examine interrupt off history.
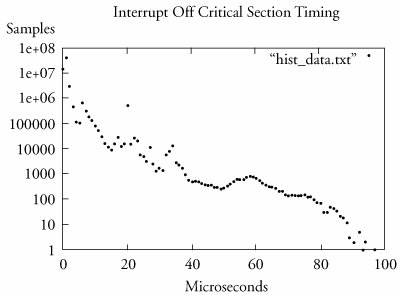
17.4.5. Interrupt Off TimingTo enable measurement of maximum interrupt off timing, configure your kernel with CRITICAL_IRQSOFF_TIMING enabled. This option measures time spent in critical sections with irqs disabled. This feature works in the same way as wakeup latency timing. To enable the measurement, do the following as root: # echo '0' >/proc/sys/kernel/preempt_max_latencyWhen this /proc file is set to zero, each successive maximum interrupt off timing result is written to this file. To read the current maximum, simply display the value: # cat /proc/sys/kernel/preempt_max_latency 97You will notice that the latency measurements for both wakeup latency and interrupt off latency are enabled and displayed using the same /proc file. This means, of course, that only one measurement can be configured at a time, or the results might not be valid. Because these measurements add significant runtime overhead, it isn't wise to enable them all at once anyway. 17.4.6. Interrupt Off HistoryEnabling INTERRUPT_OFF_HIST provides functionality similar to that with WAKEUP_LATENCY_HIST. This option gathers interrupt off timing measurements into a file for later analysis. This data is formatted as a histogram, with bins ranging from 0 microseconds to just over 10,000 microseconds. In the example just given, we saw that the maximum latency was 97 microseconds from that particular sample. Therefore, we can conclude that the latency data in histogram form will not contain any useful information beyond the 97-microsecond bin. History data is obtained by reading a special /proc file. This output is redirected to a regular file for analysis or plotting as follows: # cat /proc/latency_hist/interrupt_off_latency/CPU0 > hist_data.txtListing 17-6 displays the first 10 lines of the history data. Listing 17-6. Interrupt Off Latency History (Head)
From Listing 17-6 we can see the minimum and maximum values, the average of all the values, and the total number of samples. In this case, we accumulated slightly more than 60 million samples. The histogram data follows the summary and contains up to around 10,000 bins. We can easily plot this data using gnuplot as shown in Figure 17-5. Figure 17-5. Interrupt off latency data 17.4.7. Latency TracingThe LATENCY_TRACE configuration option enables generation of kernel trace data associated with the last maximum latency measurement. It is also made available through the /proc file system. A latency trace can help you isolate the longest-latency code path. For each new maximum latency measurement, an associated trace is generated that facilitates tracing the code path of the associated maximum latency. Listing 17-7 reproduces an example trace for a 78-microsecond maximum. As with the other measurement tools, enable the measurement by writing a 0 to /proc/sys/kernel/preempt_max_latency. Listing 17-7. Interrupt Off Maximum Latency Trace
We have trimmed this listing significantly for clarity, but the key elements of this trace are obvious. This trace resulted from a timer interrupt. In the hardirq thread, little is done beyond queuing up some work for later in a softirq context. This is seen by the wakeup_softirqd() function at 23 microseconds and is typical for interrupt processing. This triggers the need_resched flag, as shown in the trace by the n in the third column of the second field. At 49 microseconds, after some processing in the timer softirq, the scheduler is invoked for preemption. At 74 microseconds, control is passed to the actual softirqd-timer/0 thread running in this particular kernel as PID 3. (The process name was truncated to fit the field width and is shown as <...>.) Most of the fields of Listing 17-7 have obvious meanings. The irqs-off field contains a D for sections of code where interrupts are off. Because this latency trace is an interrupts off trace, we see this indicated throughout the trace. The need_resched field mirrors the state of the kernel's need_resched flag. An n indicates that the scheduler should be run at the soonest opportunity, and a period (.) means that this flag is not active. The hardirq/softirq field indicates a thread of execution in hardirq context with h, and softirq context with s. The preempt-depth field indicates the value of the kernel's preempt_count variable, an indicator of nesting level of locks within the kernel. Preemption can occur only when this variable is at zero. 17.4.8. Debugging Deadlock ConditionsThe DEBUG_DEADLOCKS kernel configuration option enables detection and reporting of deadlock conditions associated with the semaphores and spinlocks in the kernel. When enabled, potential deadlock conditions are reported in a fashion similar to this: ========================================== [ BUG: lock recursion deadlock detected! | ------------------------------------------ ... Much information is displayed after the banner line announcing the deadlock detection, including the lock descriptor, lock name (if available), lock file and name (if available), lock owner, who is currently holding the lock, and so on. Using this debug tool, it is possible to immediately determine the offending processes. Of course, fixing it might not be so easy! 17.4.9. Runtime Control of Locking ModeThe DEBUG_RT_LOCKING_MODE option enables a runtime control to switch the real-time mutex back into a nonpreemptable mode, effectively changing the behavior of the real-time (spinlocks as mutexes) kernel back to a spinlock-based kernel. As with the other configuration options we have covered here, this tool should be considered a development aid to be used only in a development environment. It does not make sense to enable all of these debug modes at once. As you might imagine, most of these debug modes add size and significant processing overhead to the kernel. They are meant to be used as development aids and should be disabled for production code. |
EAN: 2147483647
Pages: 167