| There are many ways to display the project plan. Some customers may be comfortable with an outline; some may respond well to a flowchart display. Either one can be derived from the Gantt chart. An outline can be created directly from the "Task Name" column of the Gantt chart. It is the responsibility of the project manager to communicate with his or her sponsor, not the sponsor's responsibility to figure out the project plan from an unfamiliar document. The plan should be shown to the sponsor in a form that best communicates its content. It should be passed out before the meeting in a folder that also includes a basic and a summary Gantt chart, resource utilization charts, cost charts, and the statement of work and the specification that the sponsor signed off on at the beginning of the project. Reviewing the statement of work and the specification at this time ensures a shared starting point for discussing the project plan. With our current technology, there are several possible ways to present the project's statement of work and specification to the project sponsor. If the statement of work and the specification are to be presented to a small group (3 5 people), it may be easier to distribute copies for review prior to the meeting. During the meeting, the statement of work and the specification will be reviewed by the group, item by item, to ensure agreement by all in attendance. For larger groups (6 or more people), the previous method can be used but it can be frustrating. It is much easier to display the information via a projector that is connected to a laptop computer. This display enables the team to focus on the information displayed on the screen, with the project manager leading the presentation. If the document is stored in a word processor format, open the document and display it half a page at a time, on the screen. The project manager will lead the presentation, initially focusing on the project's results and subsequently walking through the detail of how the results will be achieved. Summary Gantt charts show project duration and major task durations, in addition to project cost and major task costs as illustrated by Figure 11-1 and Figure 11-2. The detailed basic Gantt chart from which the summations are taken are shown as Figures 11-3A, 11-3B, 11-3C, 11-3D, 11-4A, 11-4B, and 11-4C. These displays are stored in the computer being used and will be displayed using a projector hooked up to the computer as needed. Expanded time scales can be introduced for discussion purposes.
Figure 11-1. 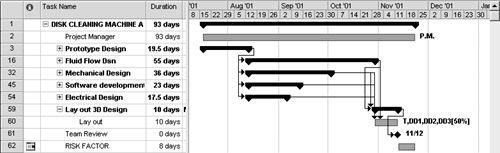
Figure 11-2. 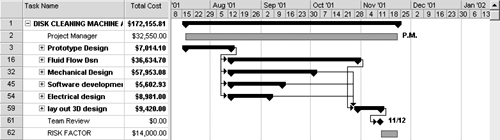
Figure 11-3A. 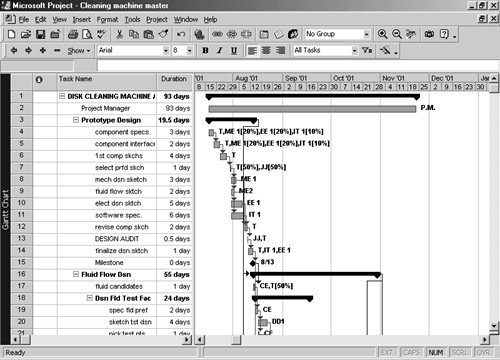
Figure 11-3B. 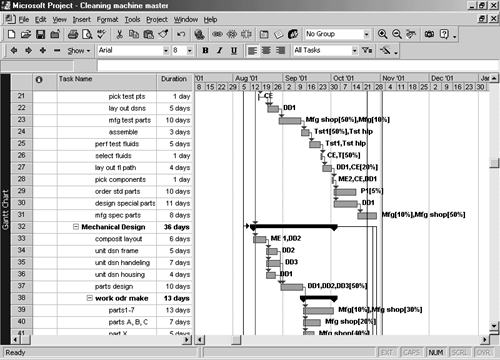
Figure 11-3C. 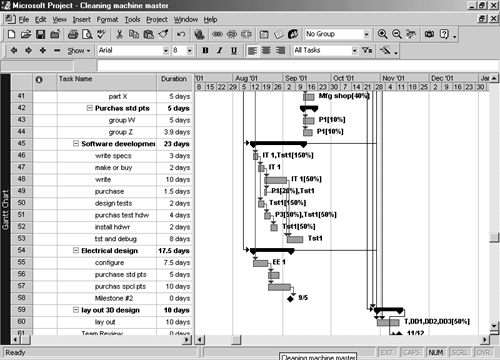
Figure 11-3D. 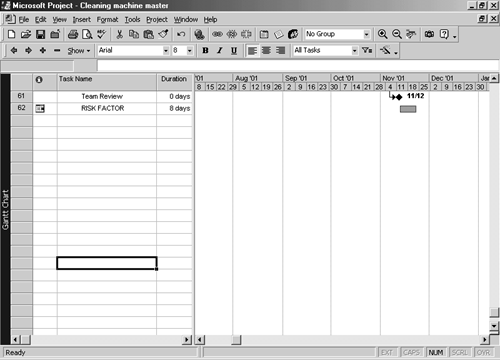
Figure 11-4A. 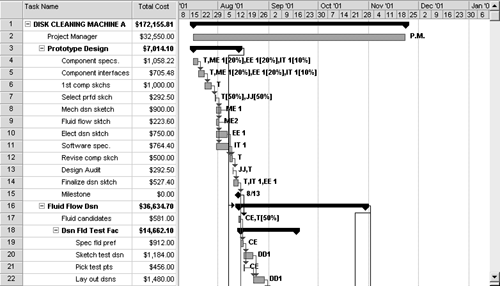
Figure 11-4B. 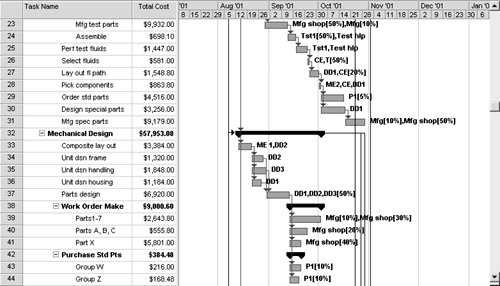
Figure 11-4C. 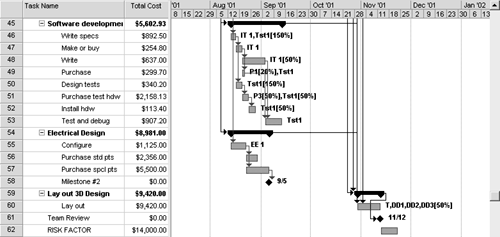
|

