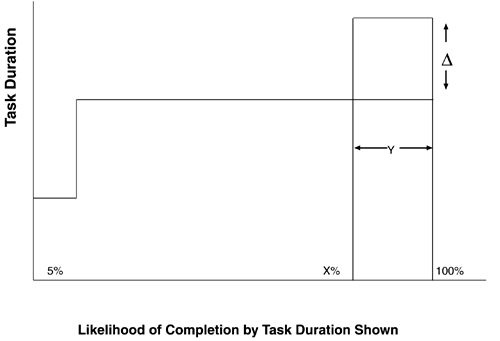
| The project Gantt chart has been completed and shows when the project would be completed if there were no uncertainties about the task durations. Because there are uncertainties about the task durations and experience tells us that the sum of most of the task time estimates is going to be inaccurate due to overruns (overestimates are rare and small, and do not impact overrun risks), it is clear that the working Gantt chart finish date is an underestimation. To provide a reliable project completion date, it is necessary to have 1) some way to add a time buffer to the end of the project, or 2) several smaller time buffers placed at intervals along the critical path that adequately allow for the amount of time some tasks overrun. Determining the time buffer is made particularly difficult because there is no way of knowing which tasks will overrun and by how much in each case. It is known, however, that most tasks in the project will not significantly overrun. The method for choosing "most of the time" estimates (M:) assures this is the case. A very simple way to calculate the project's necessary time buffer overrun would be to add up all the Ds for tasks on the critical path and to insert this duration at the end of the project. The project completion date then would be protected from overrun, but it would be greatly overprotected. It is desirable that each task with an overrun potential contribute some number measured in days to the project overrun buffer. However, letting every task contribute the D derived from its worst case is always going to be unacceptable to sponsors and customers. There is a method of calculating a useful project overrun buffer that works. Take the overrun for the worst case for a task, D, and multiply it by the likelihood that overrun of M might occur, Y, which is expressed as a decimal. Then add it with each other "contribution" calculated in this way to determine a realistic project time buffer. The project will not overrun this buffer it will finish close to the time predicted by adding the buffer. There is an added advantage to determining the buffer this way. We called the buffer the risk factor when introduced it as a task bar on the Gantt chart. It is derived from summing together the risk contributions from a string of tasks. The critical path can be divided up into units, and a risk factor can be calculated for each unit. This risk factor is entered at the end of the string instead of at the end of the whole project. Doing so enables the Gantt chart representation to more accurately identify crucial task start dates. If the overruns were accounted for at the end of the project, the start dates would not be accurately identified. Because a task will not overrun at all over 50 percent of the time, this type of task is executed there is a better than 50 percent chance it will not overrun for our project. However, if we have five tasks on our project, each with a 40 percent chance of overrun, we can be reasonably certain that from these five tasks there will be some time overrun. When we have between 20 and 30 tasks in the mix, and have an appropriate "most of the time" estimation and the likelihood of overrun and worst case data for each task, the method of calculating the contribution creates a good risk factor. The 20 or 30 tasks used in the calculation averages out the overrun. A project manager explains "most of the time," D and Y to the team members at the initial risk analysis meeting. Discussion of Figure8-1 and the "drive to work" example often help. When discussing Figure 8-1, it is important to point out that Y and D vary from task to task. The action items for each task leader at the end of the initial risk analysis meeting are to determine the Y and D that go with his or her "most of the time" estimate, to multiply them together (Y times D), and to report the product to the project manager. There is an other item of information that is needed from each task team leader so that the project manager and team can complete the risk analysis. As the task leader analyzes the possibilities of task overrun, he or she will note that over-run task instances between X and 100 percent produce different amounts of over-run, reaching D in only a small percentage of cases. The data from the overruns creeps up to the D figure as the percentage of task completion increases. For example, a task may overrun because a key task team member is unavailable. This particular team member may have a history of illness that makes him or her unavailable from time-to-time, however, the number of days he or she is unavailable can vary from one day to 10 days, with 10 days being a very infrequent occurrence. Therefore, the magnitude of task overrun caused by this task team member's unavailability varies from one day to (occasionally) up to ten days (which rarely occurs). The upward curve on the timeline in the chart in Figure 8-1 displays this type of relationship. We call this a creeping or "creep" overrun. We can assume that most overruns have this characteristic. There are, however some overruns that do not have this creeping characteristic. When one factor causes delay, it causes a significant delay and this delay amount occurs every time this factor creates a problem. For example, in a manufacturing process a task may require creating a specific part that is somewhat hard to make. A machinist will get it right a few times on the first attempt. Most often it will take two attempts. The "most of the time" task time number used is the time required for two attempts. On the infrequent occasions that a third attempt is required, the delay increases to the full time required for one more attempt. There is no creeping characteristic between the two and three attempts. The time delay rises immediately for any overruns to the full duration of a third attempt. We call this a step-function overrun. Figure 8-2 illustrates this characteristic.
Figure 8-2. 
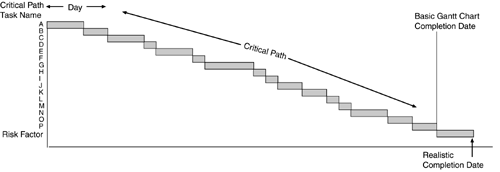
Tasks that have this "step function" characteristic occasionally turn up. It is important to the calculation of a risk factor that the task team leader, whose task can have this step-function characteristic, report the Y and D for the step-function case along with the task contribution to the risk factor to the project leader. When there is one or more tasks that have a step-function risk, it is necessary to consider this risk as a special case when calculating a risk factor. The method for calculating a contribution number for each task is laid out here. The principle that is used to determine the risk factor to be inserted on the Gantt chart timeline, which determines a realistic project completion date, is to add up the contributions from all tasks on the critical path and to use this sum as the risk factor. This procedure yields a Gantt chart that looks like the one shown in Figure 8-3.
Figure 8-3. 
|