| Java development with Sun ONE Studio is easier if you organize your work into projects. A project is a set of files, possibly of different types, that comprise one programming goal. For example, a project can be used to organize all HTML, JSP, servlets, and Beans needed for a commercial site. One big advantage of a project is your ability to view all the files associated with it at once in the Explorer Panel. This keeps your Explorer pane from becoming a jumbled mass of files. To create a new project, choose Project Manager from the Project menu. When the Project Manager dialog appears, click the New button. You will then be given a chance to name your project whatever name you choose. Following that, you will hear the hard drive work hard for a few seconds, and a new project tab will appear in the Explorer Panel with the name that you chose. Creating a Class in the Project The next step in running a program is the creation of a source code file. To do this, choose the Project xxx tab in the Explorer Panel, where xxx is the name of your project. Next, right-click the name of the project on the Project Tab's content area. This will open the dialog that is pictured in Figure B.3. Figure B.3. The New Wizard enables you to choose a template for the type of Java entity that you want to create. 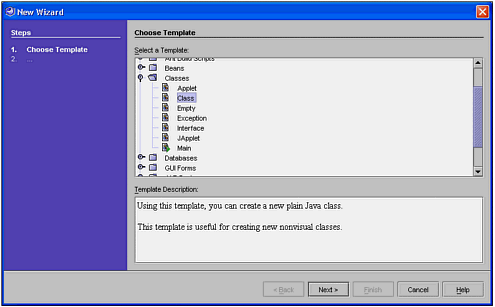 You will then be led through a series of questions about the file that you want to add to the project. The first question is for the name of the class, and the package that it will belong to. Figure B.4 shows this dialog. Figure B.4. The New Wizard enables you to specify the name and package for the new class. 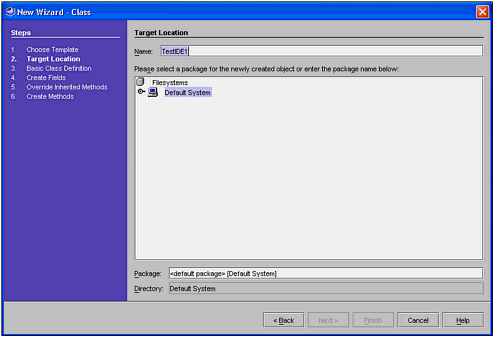 The wizard enables you to specify all types of details about the class such as field names and types, interfaces implemented, and so on. If, like many programmers, you prefer to write code to add these details, click the Finish button. Otherwise, use the dialogs to specify as many features of your class as you choose. After you click the Finish button of the wizard, your source code will be generated. You will see it appear in the Editing Panel. In the Explorer, you will now see an icon and the name of this class under the Project icon as shown here in Figure B.5 Figure B.5. The new class shows up in the Explorer as an icon and in the Editing Pane as a source code file. 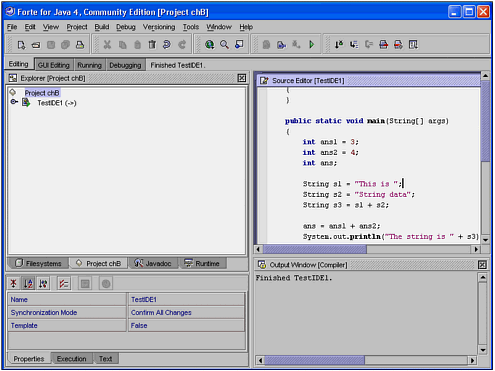 Notice how the source code file already contains certain constructs such as a Javadoc identifier, a package statement, and a constructor. If we had used more of the dialogs in the wizard, more of this code would have been generated. Caution  | You should resist the temptation to overuse the wizard to generate code for you until you know Java very well. These interfaces can be a timesaver for an experienced Java programmer, but they can be a crutch for a novice. Remember that your goal is to be a great Java programmer, not an IDE power user. |
If you look next to the class name on the Explorer Panel you will see some tiny maroon or red marks. This handy indicator means that this class has not been compiled since the last modification was made. Before we compile the class, we should actually make it produce some output and create some variables that we can examine using the debugger. All that you have to do to edit this source code is to place your mouse's cursor over the source code that you want to change, click, and start typing. Listing B.1 shows a class that has the additional lines that we need. Listing B.1 The TestIDE1.java File /* * TestIDE1.java * * Created on August 6, 2002, 3:33 PM */ /** * * @author Stephen Potts */ public class TestIDE1 { /** Creates a new instance of TestIDE1 */ public TestIDE1() { } public static void main(String[] args) { int ans1 = 3; int ans2 = 4; int ans; String s1 = "This is "; String s2 = "String data"; String s3 = s1 + s2; ans = ans1 + ans2; System.out.println("The string is " + s3); System.out.println("The answer is " + ans); } } Before you can run this program, you need to learn how to use the toolbar to compile and build the class. You do this by choosing Build from the Build menu, pressing F11, or by clicking the Build icon in the toolbar. To find what each icon in the toolbar does, you can let your mouse cursor rest on top of an icon for a few seconds until a ToolTip appears. If you have no compile errors, the output window will display the message: Finished TestIDE1. If it has compile errors, they will be displayed here also. After the program compiles, you can run it by clicking the Execute item in the Build menu, by pressing F9, or by clicking the Execute icon in the toolbar. Running this program produces the following output: The string is This is String data The answer is 7 Debugging a Java Application The IDE provides a wonderful set of tools for debugging the source code. The debugger doesn't run automatically. Regardless of the number of breakpoints that you have set, you must choose Start from the Debug menu or they will be ignored. Debug mode behaves like normal execution mode unless you set up some debugging commands before clicking Start. The simplest command is to set a breakpoint. A break point pauses the program at a certain line that you choose. This enables you to examine the value of variables, and the state of the call stack to learn how your program is behaving. Breakpoints can be either toggled or added. Toggling a breakpoint causes an unconditional breakpoint to be set or unset. Adding a breakpoint gives you the opportunity to attach conditions to the breakpoint. When the conditions are met, the program pauses. Let's add a breakpoint at line number 23, the first line of the main() method. To do this, position your cursor anywhere on line 23 and choose Toggle Breakpoint from the Debug menu. This will cause that line to turn red. Before we test our new breakpoint, let's set a couple of watches on the variables in the program. A watch tells you the value of a variable at the time that the code was last paused. There is an automatic watch that occurs for all variables in the program when you rest the mouse cursor over any variable currently in scope. A ToolTip will pop up and tell you its value. The second type of watch appears in the Debug pane while a program is running or paused. To add a manual watch, choose Add Watch from the Debug menu. A dialog will appear that enables you to specify which variable you want watched. In this example, let's specify that we want to watch the variable ans1. Next, choose Start from the Debug menu. This will move the cursor to the first breakpoint, where it will pause. Choose Step Over from the Debug menu to move down one line. We need to do this so that our watched variable, ans1, will have a value. Figure B.6 shows what the IDE looks like at this point. Figure B.6. The IDE changes to Debug mode showing the breakpoints, watches, and call stack in the Explorer panel. 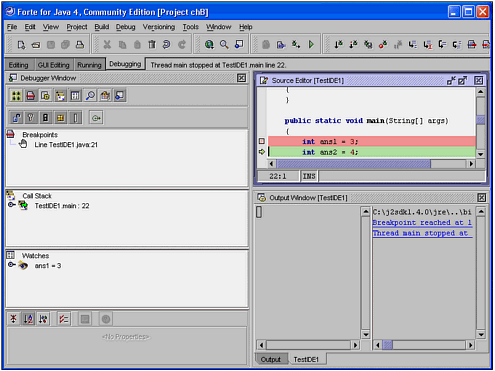 Notice in the left panel that the breakpoint, the watch, and the method calls that are on the stack are all visible. If we want to continue stepping, we can choose Step Over from the Debug menu again and again. Alternatively, we could set another breakpoint in the program and choose Continue from the Debug menu to pause when the new breakpoint is reached. If we decide that we want to just let the program terminate immediately, we choose Finish from the Debug menu. The program will terminate automatically when the last executable line, the in main() method, has been processed. | 