| You can divide the content of an Access report into two general categories: information derived from records in one or more tables, and everything else. The everything else category includes the title, page headers and footers, introductory and explanatory text, logo, background and graphics, and calculations based on the database content. You can create a basic report by using the Report wizard, which provides a simple layout, attaches styles, and adds a text box control and its associated label for each field you specify. If the basic report doesn't fit your needs, you can refine it in Design view. When you include more than one table in a report, the wizard evaluates the relationships between the tables, and offers to group the records in any logical manner available. Important If relationships between tables aren't already established in the Relationships window, you have to cancel the wizard and establish them before continuing. The necessary relationships have already been defined in the practice files.
See Also For information about creating relationships between tables, see the sidebar "Relationships" in Chapter 5, "Simplifying Data Entry by Using Forms."
You can group the information in a report based on the data in one or more fields. You can, for example, group products by category. When you do this the wizard first sorts the table based on the category, then sorts the products in each category. It then creates a group header each time the category changes. It can also add a footer to each group, in which it summarizes the information in the group. In this exercise, you will create a simple report that displays an alphabetical list of products. Tip The Report wizard leads you through a series of questions and then creates a report based on your answers. This exercise guides you through the process of creating a standard report without justifying the data selected, but when you get around to creating your own reports you should first consider the end result you want, and what information you need to include in the report to achieve that result.
USE the 01_Wizard database. This practice file is located in the Chapter08 subfolder under SBS_Access2007. BE SURE TO start Access before beginning this exercise. OPEN the 01_Wizard database, and acknowledge the safety warning if prompted to do so.
1. | On the Create tab, in the Reports group, click the Report Wizard button.
The Report wizard starts.
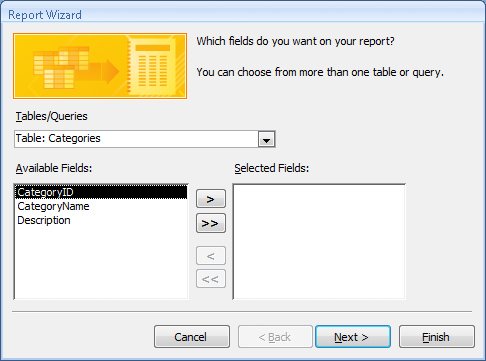 | 2. | On the field selection page, click the Tables/Queries arrow, and then in the list, click Table: Products.
Access displays the fields from the Products table.
| 3. | In the Available Fields list, double-click ProductName, QuantityPerUnit, and UnitsInStock to move them to the Selected Fields list.
Tip Fields appear in a report in the same order that they appear in the Selected Fields list. You can save yourself the effort of rearranging the fields in the report by entering them in the desired order in the wizard. | 4. | In the Tables/Queries list, click Table: Categories to display the fields from the Categories table.
| 5. | In the Selected Fields list, click ProductName.
The next field you add will be inserted following the selected field.
| 6. | In the Available Fields list, double-click CategoryName.
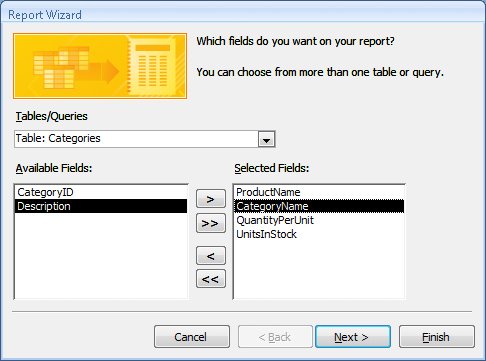 Tip If you are using more than two tables in a form or report, or if you will be using the same combination of tables in several places, you can save time by creating a query based on those tables, and by using the results of that query as the basis for the form or report. | 7. | On the field selection page, click Next.
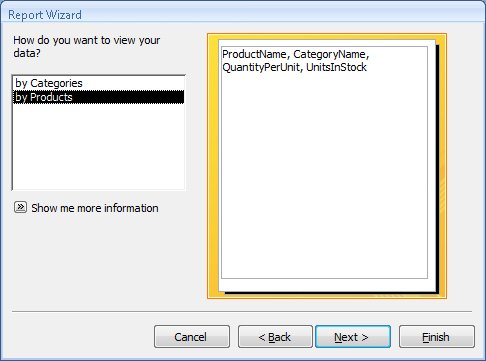 You can view the records in this example by category or by product; clicking either option depicts the arrangement in the right pane.
| 8. | On the grouping page, with by Products selected, click Next.
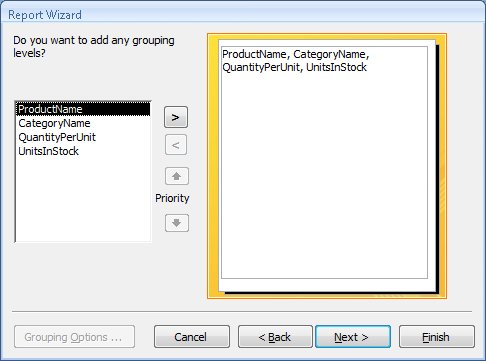 You can specify the fields used to establish grouping levels. When you group by a field, the report includes a group header and footer around each group of records that have the same value in that field.
| 9. | On the grouping levels page, double-click ProductName to move it to the top of the preview pane. Then click the Grouping Options button.
The Grouping Intervals dialog box opens.
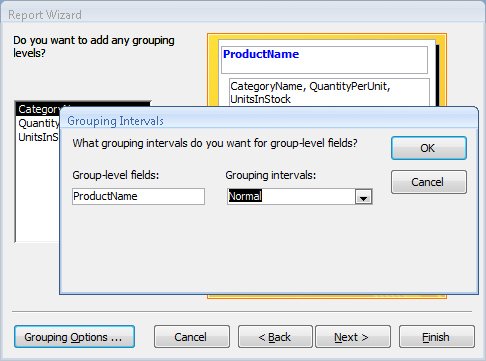 | 10. | In the Grouping intervals list, click 1st Letter. Then click OK.
Selecting this option creates a new group header each time the first letter of the category changes.
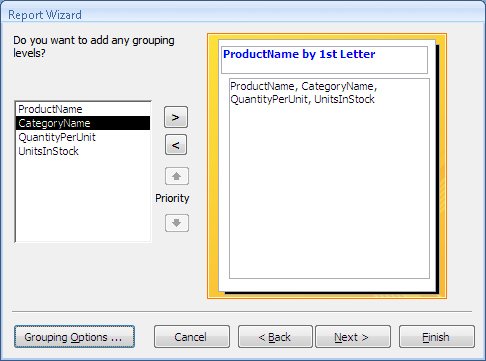 | 11. | On the grouping levels page, click Next.
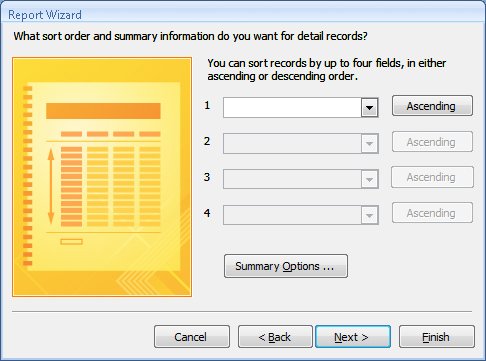 You can sort report information by up to four fields, each in ascending or descending order. When you sort by any field that contains numeric information, the Summary Options button appears at the bottom of the wizard page. In the Summary Options dialog box, you can instruct Access to display the sum, average, minimum, or maximum value for the field in the report.
The only numeric field in this report is UnitsInStock, and there is no need to summarize it.
| 12. | Click the arrow to the right of the first box to display a list of fields, and click ProductName. Then click Next.
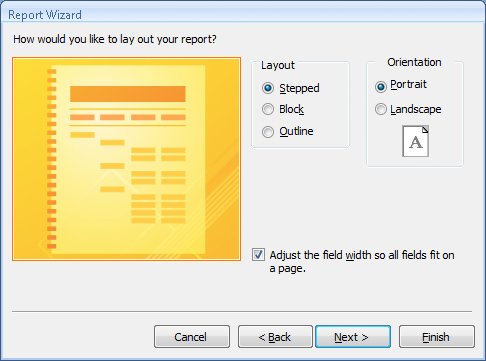 | 13. | In the Layout area, select the Outline option. With the Portrait orientation option and the Adjust the field width so all fields fit on a page check box selected, click Next.
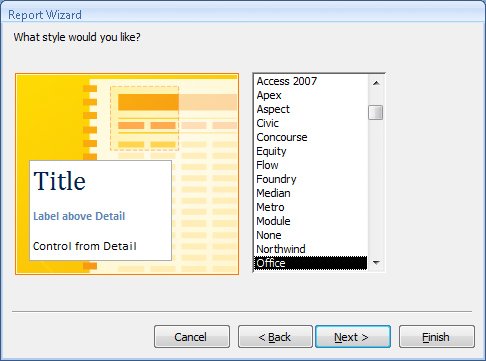 | 14. | On the style selection page, in the list of styles, click Flow, then click Next to display the wizard's final page.
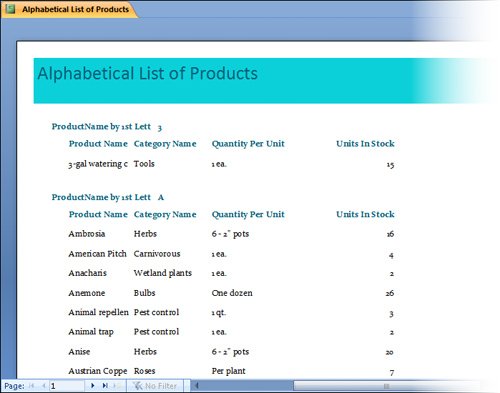
| 15. | In the title box, type Alphabetical List of Products, and then with the Preview the report option selected, click Finish.
Access creates and displays the report.
 |
CLOSE the Alphabetical List Of Products report and the 01_Wizard database.
|