Introducing the AWR
Introducing the AWRThe Automatic Workload Repository (AWR) is a new infrastructure component that is at the heart of the collection and processing of the vast amount of performance data in Oracle Database 10g. The data collected by AWR forms the basis for most of the problem-detection and self-tuning mechanisms that Oracle Database 10g provides. In fact, the performance-alert mechanisms rely on this data, as do many of the performance advisors. The Automatic Database Diagnostic Monitor (ADDM) uses this data as well, performing scheduled analysis of the data collected by AWR. AWR consists of two components: in-memory performance statistics, accessible through V$ views, and snapshots of these V$ views "persisted" in the database that record the historical values. AWR CollectionAWR consists of the following collections:
In this list, the collection for all but the last item is new.
Unlike other Oracle background system processes such as SMON (System Monitor) or PMON (Process Monitor), the death of these performance-related background processes does not stop or abort the database. The health of these background processes does not affect the main system because these processes are not really deemed essential from an operational point of view. When these processes die, an appropriate message is posted in the alert.log and processing continues. Performance data, however, stops being collected when these processes die for any reason. So how does all of this happen? The Oracle kernel allocates a small but distinct portion of the System Global Area (SGA) to buffers that are dedicated to holding session history and other AWR-related information. These in-memory buffers are updated by the MMNL and MMON background processes via sampling of session information and counters. The Memory Monitor Light (MMNL) process, new to Oracle Database 10g, performs tasks such as session history capture and metrics computation and stores this information in these buffers. It also persists the statistics in these buffers to disk as needed in the form of AWR tables. The Memory Monitor (MMON) process performs various background tasks, such as issuing alerts whenever a given metric violates its threshold value and taking snapshots by spawning additional process (MMON slaves), among others. Together, they are responsible for the statistics, alerts, and other information maintained by AWR. These statistics are made permanent in the AWR, which consists of a number of tables. By default, these background jobs automatically generate snapshots of the performance data once every half hour and flush the statistics to the workload repository. The Automatic Database Diagnostic Monitor (ADDM) then kicks in to analyze the data from the immediately prior and current snapshots, and to highlight any performance issues or problems. You can perform all this manually as well, and you will see how to do that later in this chapter. Ultimately, because SQL executing in a user or background session produces database work and hence load, AWR works to compare the difference between snapshots to determine which SQL statements should be captured based on their effect on the system load. You saw examples of such SQL in the previous chapter when looking at how OEM uses this data. This reduces the number of SQL statements that need to be captured over time, while still capturing the essential ones. Out of the box, AWR serves as a performance warehouse for the Oracle Database 10g, generating, maintaining, and reporting these performance statistics. AWR purges its own data in a scheduled manner, thus self managing itself.
Comparison to STATSPACKIn many ways, AWR rose from the foundation laid by STATSPACK. The concepts are similar: Capture snapshots of required internal V$ views, store them, and analyze them. There are some major differences between AWR and STATSPACK, however. We hinted at this in the previous chapter, and it is worth looking at both the similarities and differences here:
These similarities have prompted the renaming of the AWR/ADDM combination to "STATSPACK on Steroids"a steroid we would heartily recommend!
AWR Storage and ReportingAll the AWR objects (tables and their indexes) start with one of the following prefixes:
All these tables reside in the SYSAUX tablespace. In fact, in Oracle Database 10g Release 1, there are 140 of these tables, and many of the larger ones are range-partitioned by DB_ID and SNAP_ID along with their indexes, which helps during purging of older snapshot information. The table names have suffixes that are the same or similar to their equivalents in STATSPACK's PERFSTAT schema. For example, the statistical contents and use of the STATS$FILESTATXS table of STATSPACK and the WRH$FILESTATXS table of AWR are the same; they store snapshot detail information from V$FILESTAT. Hence, understanding their use is simpler if you already know of their use in STATSPACK. A number of views can access some of these tables. Generally, these views start with the DBA_HIST prefix, and some of them are detailed in Table 11.1. You looked at some of the base views that are captured in the snapshot by AWR in the previous chapter. This list is not comprehensive, but is indicative of every type of view.
The amount of space occupied by these AWR objects depends on the following:
By default, snapshots are taken every half hour and retained for a period of seven days. You will see later in this chapter, in the section titled "Customizing the AWR," how these intervals can be changed. The space usage can be seen using the query shown in Listing 11.1. Listing 11.1. AWR Data from the V$SYSAUX_OCCUPANTS ViewSQL> select occupant_name, occupant_desc, space_usage_kbytes 2 from v$sysaux_occupants 3 where occupant_name like 'SM%'; OCCUPANT_NAME OCCUPANT_DESC SPACE_KB --------------- ------------------------------------------------------- -------- SM/AWR Server Manageability - Automatic Workload Repository 83,072 SM/ADVISOR Server Manageability - Advisor Framework 8,512 SM/OPTSTAT Server Manageability - Optimizer Statistics History 21,120 SM/OTHER Server Manageability - Other Components 8,704
A more detailed report of AWR objects, usage, and the like, along with information on Active Session History (ASH), can be produced using awrinfo.sql. This is found in the $ORACLE_HOME/rdbms/admin directory in UNIX or the equivalent %ORACLE_HOME%\RDBMS\ADMIN directory in Windows. A large amount of information is reported under the headings shown in Listing 11.2. Listing 11.2. Various Heads Under Which AWR Information Is Reported(I) AWR Snapshots Information (1a) SYSAUX usage - Schema breakdown (1b) SYSAUX usage - SYS Schema (2) Size estimates for AWR snapshots (3a) Space usage by AWR components (per database) (3b) Space usage within AWR Components (> 500K) (4) Space usage by non-AWR components (> 500K) (5a) AWR snapshots - last 50 (5b) AWR snapshots with errors or invalid (5c) AWR snapshots -- OLDEST Non-Baselined snapshot (6) AWR Control Settings - interval, retention (7a) AWR Contents - row counts for each snapshot (7b) AWR Contents - average row counts per snapshot (7c) AWR total item counts - names, text, plan (II) ASH Usage Info (1a) ASH histogram (past 3 days) (1b) ASH histogram (past 1 day) (2a) ASH details (past 3 days) (2b) ASH details (past 1 day) (2c) ASH sessions (Fg Vs Bg) (past 1 day across all instances in RAC) Of these, Size estimates for AWR snapshots is quite useful because it enables you to see the effects of increasing or decreasing the snapshot frequency or manipulating the retention periods. Also note that storage of objects related to ASH is also detailed here. Of interest is the section ASH histogram (past 3 days) (or even ASH histogram past 1 day). This histogram gives a fair indication of the number of sessions active at any point of time during that period.
Accessing the AWR SnapshotsThe AWR snapshots can be accessed using either the OEM screens or directly from a SQL aware tool such as SQL*Plus or iSQL*Plus. When using OEM, you can use either of the following routes:
Figure 11.1 shows the Snapshots page. Note that you can use the drop-down menu next to the Go button to perform any of the following tasks:
Figure 11.1. AWR snapshots and their details.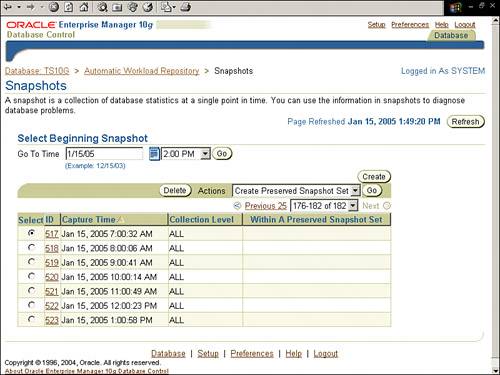 You can also use the Create button to create an on-demand snapshot. The AWR can be accessed from SQL using calls to the DBMS_WORKLOAD_REPOSITORY built-in PL/SQL package to perform required processes. To generate reports, you can use the following SQLs found in the $ORACLE_HOME/rdbms/admin directory in UNIX (%ORACLE_HOME%\RDBMS\ADMIN directory in Windows):
You will notice that awrrpt.sql produces a report that is similar to STATSPACK, but has more sections that cover the new views that Oracle Database 10g provides. Some of the new sections are shown in Listing 11.3. Listing 11.3. Various New Sections in the AWR Report[View full width] Time Model Statistics Operating System Statistics Service Statistics and Service Wait Class Stats SQL ordered by Elapsed Time, CPU Time ( in addition to the SQL ordered by Gets, Reads and Note that if you don't specify otherwise, invoking the awrrpt.sql script displays only the last three days of snapshot settings. Use awrinput.sql followed by the awrrpt.sql script to report on previous snapshots. This is a little cumbersome, but it does avoid displaying the list of all the previous snapshots as is done with a STATSPACK report. |
EAN: 2147483647
Pages: 214