| Excel's pivot tables are reports that summarize worksheet data and lay it out in a more meaningful format. For example, suppose you had a database that kept track of your monthly sales by product and salesperson. You could create a pivot table to summarize the amount of each product sold each month by each salesperson. You could then quickly rearrange the table to analyze the data in various ways. Figure 11.12 illustrates how a pivot table works. Figure 11.12. A pivot table summarizes and organizes your data. 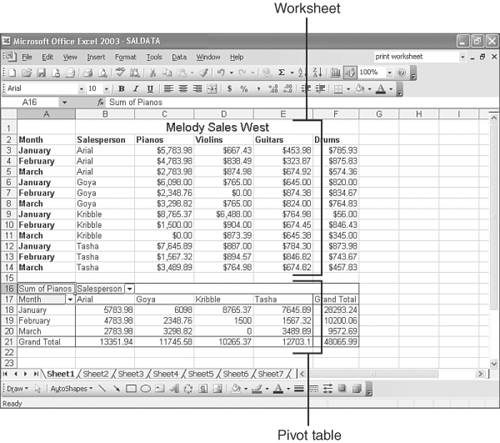 Note  | If this is your first encounter with pivot tables, expect to spend some time working with them. After you become accustomed to the data buttons, the concept will seem easy to you, but becoming accustomed to the data buttons takes patience and practice. |
Creating a Pivot Table Using the PivotTable Wizard Fortunately, Excel provides a useful tool that can lead you step-by-step through the process of creating a pivot table: the PivotTable Wizard. You simply run the wizard, and it prompts you to specify the following four elements: Pages: Pages enable you to create a drop-down list for one of the rows or columns in your worksheet. For example, you can use the Salesperson column to create a pages drop-down list that contains the names of all your salespeople. Select a salesperson from the list to see how much of each item that person is selling per month. Rows: Rows display row labels you may have entered along the left side of the worksheet. Columns: Columns display the column labels used in the worksheet. You can have up to eight columns. Data items: These are the values you want added to the pivot table for analysis. Typically, these values consist of the data entries rather than row or column labels. The procedure for creating a pivot table varies depending on whether you are selecting a single range of cells or multiple ranges. The following two sections cover both options in turn . Creating a Pivot Table from a Single Range You create a pivot table by running Excel's PivotTable Wizard, which leads you through the process with a series of dialog boxes. Here's how you use the PivotTable Wizard to create a pivot table from a single data range: -
Open the Data menu and choose PivotTable and PivotChart Report . Excel displays the PivotTable and PivotChart Wizard Step 1 of 3 dialog box. -
Make sure Microsoft Excel List or Database and PivotTable are selected, as shown in Figure 11.13, and then click the Next button. The PivotTable and PivotChart Wizard Step 2 of 3 dialog box appears, asking you to select the range of cells you want to transform into a pivot table. Excel shows a blinking dotted box that indicates what data it thinks you want to use. Figure 11.13. The PivotTable and PivotChart Wizard lead you through the process of creating your pivot table.  -
Type the cell addresses that define the range, or select the desired cells using your mouse, as shown in Figure 11.14. Figure 11.14. Select the desired range for your pivot table. 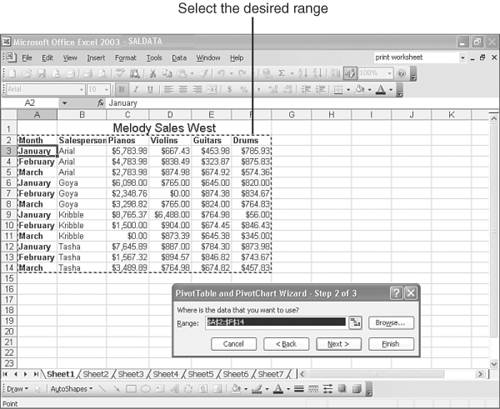 -
Click the Next button. The PivotTable and PivotChart Wizard Step 3 of 3 dialog box appears, asking whether you want to place the pivot table on the current worksheet or a new worksheet. -
Choose New Worksheet or Existing Worksheet to specify where you want the pivot table placed, and then click Finish . Excel displays a blank pivot table along with a PivotTable Field List box that lists the fields you can add to the pivot table. -
To add an item from the PivotTable Field List to your pivot table, drag the item from the list to the desired area on the pivot table, and then release the mouse button. Figure 11.15 illustrates the process. Figure 11.15. Drag the field entries to the pivot table to specify how you want the data arranged. 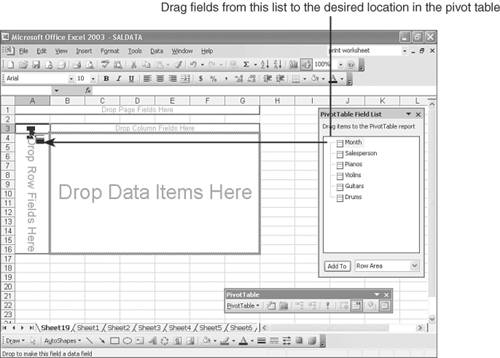 -
Repeat step 6 to add any additional items to your pivot table. Creating a Pivot Table from Multiple Ranges If you have data on several worksheets, or several separate ranges on the same worksheet, you can have Excel consolidate that data in a pivot table. To do so, select Multiple Consolidation Ranges from the PivotTable and PivotChart Wizard Step 1 of 3 dialog box. When it is time for you to specify the ranges, you'll see the dialog box shown in Figure 11.16. Select the first range and click the Add button. Repeat the steps for subsequent ranges. The PivotTable and PivotChart Wizard dialog box stays onscreen as you flip through your worksheets and select ranges. Figure 11.16. You can select more than one range from a worksheet or from separate worksheets. 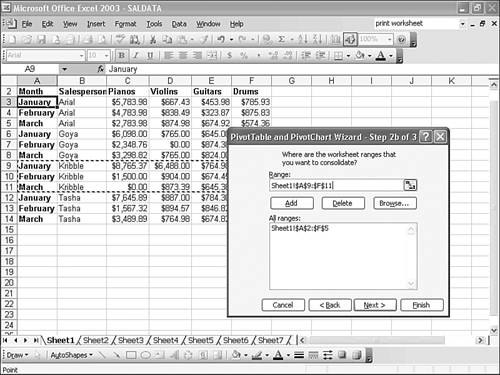 Note | | When the PivotTable and PivotChart Wizard is done, it creates a table that may or may not be exactly what you wanted. Don't worry. Later in this chapter, in the section called "Rearranging Data in a Pivot Table," you will learn how to drag data around for the desired effect. |
Rearranging Data in a Pivot Table Don't worry if your pivot table didn't turn out as you had envisioned it. You can rearrange the data simply by dragging the field buttons around onscreen, as shown in Figure 11.17. Figure 11.17. Drag the field buttons onscreen to rearrange your pivot table. 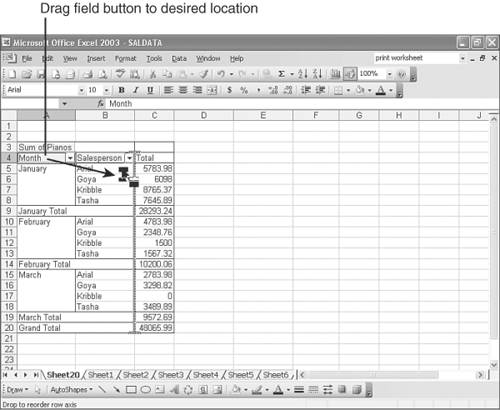 The Absolute Minimum In this chapter, you learned that Excel not only provides the tools you need to create automated accounting worksheets, but it also acts as a database management tool, helping you store, manage, and analyze your records. Upon completing this chapter, you know the essential database terminology and concepts required to understand databases and you can use Excel to create and manipulate a database. Specifically, you now know how to Create a database by entering column labels and records and how to use a form to add records to your database. Find specific records without having to search for them manually. Sort your records alphabetically or numerically based on the entries in any field. Bring up a select group of records by using AutoFilter. Summarize, compare, and analyze data by using a pivot table. With the skills you acquired in this chapter, you can create databases for storing contact lists, inventories, employee records, mailing lists, and even information about your video collection. The next chapter explores another slightly more advanced topic as you learn to customize Excel to enhance its performance and better suit the way you work. | |