10.2 Programming Charts
10.2 Programming Charts
First attempts at programming charts are often very difficult. The reason is that it is not easy to acquire an orientation among the multitude of Chart objects, and the association of properties and methods is not always clear.
Here is an example: The method ClearContents of the ChartArea object clears the data of a chart, but not its formatting. This is strange , in that the ChartArea object is actually not responsible for the chart itself, but only for its background. It would have been more logical if chart data were deleted via the Delete method of the Chart object, but this method returns nothing but an error message in the case of an embedded chart. Apparently, Delete is suitable only for deleting chart sheets , while the two related methods ClearContents and ClearFormats of the ChartArea object are responsible for the internal affairs of charts.
In constrast to the ChartArea object we have the PlotArea object. This object also describes the background of the chart, though in this case the area immediately behind the chart lines, bars, and so on.
| Remark | Though at the outset you may feel overwhelmed by the surfeit of objects and their properties, there are positive aspects to the situation:You can truly run almost the entire chart business with program code. Alas, space does permit a full description of this plenitude. For many details you will be referred to the on-line help after finishing this chapter. |
Instead of Searching Fruitlessly, Use the Macro Recorder!
If you would like to know how you can achieve a particular formatting result in program code, then use the macro recorder as your trusted adviser (the examples from the on-line help are practically useless).
The shorter the recording session, the easier it will be for you to interpret the results. Therefore, you should start recording in a chart that already exists, change only a single detail, and then stop recording at once. If you arrange on your monitor one window with program code and a second one with the chart, you can even observe during recording when each line of code is generated.
The code that results from the macro recording usually works (at least no counterexamples appeared during the preparation of this chapter), but it is seldom optimal. In part, the instructions are unnecessarily convoluted, and in part they are completely superfluous. Therefore, the code must be edited after the fact.
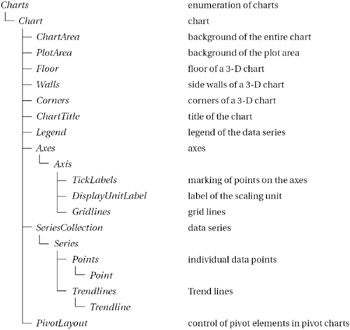
Object Hierarchy
The following compilation provides an overview of the object hierarchy for charts. To make the structure clearer, only the most important objects have been included and only the case considered that the chart is embedded in a worksheet (no chart sheets). A complete listing of all chart objects can be found in Chapter 15.
A Brief Glossary of Chart Objects
There is enormous confusion surrounding the numerous and often like-named Chart and Plot objects. Figure 10-2 provides a first overview.
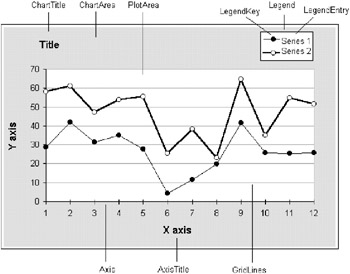
Figure 10-2: The most important objects of a chart
Chart : This is the actual chart; it consists of several data series that are graphically represented, the background, the coordinate axes, the legend, the title, and so on. Access to Chart objects is achieved either through the enumeration Charts , if the chart is located in a chart sheet, or via ChartObjects( ).Chart , if the chart is embedded in a worksheet.
The chart type is set, since Excel 97, with the property ChartType (formerly Type and SubType ). Over seventy constants have been defined as possible settings (see the on-line help or the object browser).
ChartObject : This is the outer frame (container) of a chart. The ChartObject object is necessary only with charts that are embedded in worksheets. It stands between the worksheet and the Chart object and determines the position and dimensions of the chart within the worksheet. With the Worksheet method ChartObjects you can access the list of all chart objects of a worksheet.
You access the associated chart with the Chart property of the ChartObject object. (Note: In addition to charts a host of other objects can be embedded in worksheets, such as controls, lines, and rectangles. You can access the totality of these objects, including charts, with the method DrawingObjects ).
ChartArea : This is the background of the chart. With the properties of this object you can set color , borders, and so on. However, this object has a greater significance insofar as its methods Copy , Clear , ClearContents , and ClearFormats relate to the actual subordinate Chart object (Microsoft alone knows why). In the case of embedded charts the method Select can be used only if first the associated ChartObject object has beed activated with Activate .
ChartGroup : This object groups various chart types within a chart. Normally, a chart possesses only a single chart group . In this case the ChartGroup object is irrelevant. This object, then, has significance only when in a composite chart two or more chart types are united (for example, a bar chart and line chart). In this case the chart is managed by several groups with differing chart types ( Type property).
Charts : The chart object contains the enumeration of all chart sheets of a workbook. The like-named method immediately returns the Chart object. There is, then, no separate chart sheet object comparable to a worksheet. For chart sheets, no intermediate ChartObject is necessary.
Some additional objects do not, in fact, begin with "Chart," but they are nonetheless of interest.
PlotArea : This is the "graphical" area within a chart. The plot area contains the coordinate axes and the actual chart graphic. The main task of this object consists in determining the size and position of this region within the total area of the chart. Other regions in the chart are the legend ( Legend object) and the title ( ChartTitle object). In the case of three-dimensional charts the objects Floor and Walls (as subobjects of Chart ) are managed independently of PlotArea . These two objects are responsible for the visual appearance of the boundary surfaces of a three-dimensional chart.
| Note | When you execute PlotArea.Width=n: m=PlotArea.Width, then m is distinctly larger than n. The reason is that PlotArea.Width actually changes the write-protected property InsideWidth introduced in Excel 97, that is, the inside region of PlotArea. In addition to this inside region there is an outside region, in which the labeling of the coordinate axes appears. (The same problems occur also with Height/InsideHeight, of course). To set the size of the outside region you can usually rely on the following code: delta = PlotArea.Width - PlotArea.InsideWidth PlotArea.Width = n + delta This method is not quite exact either, since the size of the label area is not constant. For example, if a chart is greatly reduced in size, Excel simply does without axis labels, and the label area is reduced to size 0. |
Series , Point : The Series object refers to the data of a data series belonging to a chart. The actual numerical values can be taken from the Values property of the Series object, which can also be used to change these values. Series is a subobject of the Chart object. Formatting data that affect not the entire series but only an individual data point are controlled by Point objects. These are again a subobject of the Series objects.
Axis , Gridlines : The Axis object is also a subobject of the Chart object. It describes the details of a coordinate axis. The Gridlines object is a subobject of the Axis object and is addressed via the properties MajorGridlines and MinorGridlines .
New in Excel 2000 is the ability to specify scaling units for the coordinate axes (for example, "millions"). In this case Axis.DisplayUnit must be set with a predefined constant (for example, xlMillions ). The DisplayUnitLabel object specifies how and where this scale unit (that is, in this example "Millions" ) is displayed in the chart. The property HasDisplayUnitLabel specifies whether the axis is scaled.
In addition to the predefined scaling units (10, 100, 1000, up to 1,000,000,000) any other factor can be used. For this, DisplayUnitCustom is assigned the desired value (which can also be less than 1, for example, 0.001 to represent thousandths). See Figure 10-3, in which the Y -axis is displayed in units of thousandths.
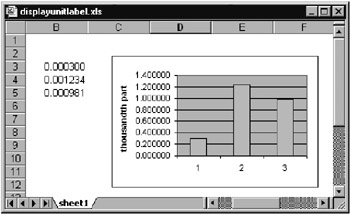
Figure 10-3: The Y-axis uses thousandths as scaling unit.
ActiveChart.Axes(xlValue).DisplayUnitCustom = 0.001 ActiveChart.Axes(xlValue).DisplayUnitLabel.Text = "thousandth part"
Trendline , ErrorBars : Trendline and ErrorBars are subobjects of the Series object. They describe the details of a trend line of a data series and, respectively, the appearance of the error bars.
| Tip | The keywords Gridlines and ErrorBars appear in the plural, and in contrast to other pluralized Excel objects, they do not refer to enumeration objects. |
| Tip | If you do not know the name of a particular object in a chart, you can click on that object (for example, a coordinate axis) and execute ?TypeName(Selection) in the immediate window. As result you obtain the object name (in this example, Axis). |
Programming Techniques
The Chart Wizard
The method ChartWizard offers, in general, the fastest route to creating a chart. In order to use this method, you must first generate a ChartObject object. You can read all about the infinitude of parameters associated to this method in the on-line help.
ActiveSheet.ChartObjects.Add(30, 150, 400, 185).Name = _ "new chart" ActiveSheet.ChartObjects("new chart").Activate ActiveChart.ChartWizard sheet1 .[A3:D99], xlLine, 4, xlColumns, 1, 1 Chart Objects: Activate or Select?
With the methods Activate and Select Microsoft has blessed us with a certain amount of confusion: Sometimes one method must be used ( windows ), sometimes the other (worksheets), and sometimes both are allowed (ranges of cells ). In the case of ChartObject objects not only are both methods allowed, but they lead to different results!
Activate corresponds to a single click on a chart. Selection now refers to the object PlotArea (thus not to Chart )!
Select seemingly also corresponds to a single click on a chart. However, the Selection property now refers to a ChartObject object. Therefore, use Select when you wish to change the position or size of a chart in a worksheet but you do not wish to change features of the actual chart.
Sheets(1).ChartObjects(1).Select
The two methods have in common that the Chart object can then be accessed via ActiveChart .
| Caution | In Excel 97 access to a chart via ActiveChart led at times to serious problems. Access the object in question directly instead of first activating it and then altering it via ActiveChart. |
Deactivating Chart Objects
The best way to deactivate a chart is by activating some other object. For example,
Sheets(n).[A1].Select
Deleting, Copying, and Inserting Charts
ChartObject objects can be directly copied together with the chart contained therein with Copy and then again inserted into the worksheet. After the insertion, the Selection property refers to the new ChartObject object, so that this can then be named. If you simply wish to duplicate a ChartObject object, you can use the method Duplicate directly instead of Copy and Paste . With Delete you can delete a ChartObject object together with all the data contained therein.
ActiveSheet.ChartObjects(1).Copy ActiveSheet.Paste Selection.Name = "new chart" ' ... ActiveSheet.ChartObjects("new chart").Delete The situation is somewhat different if you wish to delete, copy, or insert only the chart data without altering the ChartObject object. In this case the ChartArea object takes center stage (since there is no Copy method defined for the Chart object). Upon insertion into another chart object you must then refer to that Chart object.
ActiveSheet.ChartObjects(1).Chart.ChartArea.Copy ActiveSheet.ChartObjects(2).Chart.Paste
With deleting chart data, too, you have to access the ChartArea object. Clear deletes all the chart data, ClearContents only the chart's contents (here is meant primarily the data series), and ClearFormats only the formatting information.
If you wish to insert an empty ChartObject into a worksheet (that is, an empty chart framework), you apply the Add method to ChartObjects . To this method are passed the position and size specifications (in points: 1 point = 1/72 inch = 0.35 mm). A name can be given at once to the new object:
ActiveSheet.ChartObjects.Add(0, 0, 200, 100).Name = "new chart"
Aligning Several Charts
When you place two or more charts in a worksheet with the mouse, you will soon find out that it is relatively difficult to create two charts of exactly the same size lying one precisely above the other. A very good assistant in this enterprise is the menu of the Drawing toolbar. With its menu items you can align previously selected objects (including charts). Another variant consists in simply accessing the Left , Top , Width , and Height properties of the ChartObject object.
The following instructions in the immediate window were used to align the five charts of a monthly report (see the next section) horizontally corresponding to the position and size of the first chart.
set wb = Worksheets("MonthlyReport") For i=2 To 5: wb.ChartObjects(i).Left = _ wb.ChartObjects(1).Left: Next i For i=2 To 5: wb.ChartObjects(i).Width = _ wb.ChartObjects(1).Width: Next i Using Ready-Made Charts or Custom Formats
The complete setting up of a chart with all its formatting details is possible via program code, but this is a laborious and complex programming endeavor. If the appearance of a chart is in any case predetermined (and independent of the data to be processed ) it makes more sense to save the completed chart in a worksheet or chart sheet and use program code only to change the data used to draw the chart. The actual formatting of the chart can be carried out directly with the mouse and without programming effort. (The procedure MonthlyProtocol in the next section provides an example.)
The use of autoformat requires more than minimal programming, but is still better than programming a chart from scratch. With autoformats , which in turn are derived from charts that you have formatted in the traditional way, you can change practically all the formatting data of a chart generated by program code with a single instruction. Then you need to carry out at most a few instructions for the optimal sizing of individual chart elements. The application of an autoformat to an existing chart is carried out, since Excel 97, with the method ApplyCustomType (formerly AutoFormat ).
ActiveChart.ApplyCustomType ChartType:=xlUserDefined, _ TypeName:="DailyReport"
The deployment of autoformats is problematic when you wish to install a complete Excel application on another computer. Personal autoformats are stored in the file Userprofile\Application Data\Microsoft\Excel\Xlusrgal.xls . This file cannot be copied to another computer, because you would thereby overwrite the autoformats of another user . Thus the transmission of autoformats in a file is impossible .
However, there is a way around this restriction. You should include in your application a worksheet in which you have embedded a simple example chart for each autoformat used. When the program is launched, activate these example charts one after the other and save their format information as autoformats on the computer on which the application is being run.
Application.AddChartAutoFormat Chart:=ActiveChart, _ Name:= "new autoformat", Description:=""
Unfortunately, there is no way to determine which autoformats have already been defined. An object such as AutoFormats does not exist in the current version of Excel.
Printing and Exporting Charts
Printing a chart is carried out with the method PrintOut , which can be applied to both Chart and Workbook objects. Since Excel 97 charts can also be exported into a graphics file in various formats with Export .
ActiveChart.Export "test.gif", "GIF"
According to the on-line documentation, in the second parameter you can provide all of the graphics formats for which export filters have been installed. What filters exists, what they are called, and how the program can determine whether a particular filter is installed are not revealed in the documentation. Therefore, protect your procedures for exporting with On Error . Experiments with Export have succeeded with the following formatting character strings:
"GIF", "JPEG", "TIF", "TIFF", "PNG"
On the other hand, "BMP" and "WMF" , that is, the two standard Microsoft formats for bitmaps and for simple vector graphics, are not supported. If you require charts in these formats, you can use the method CopyPicture , which copies the chart to the clipboard. Unfortunately, the exportation ends there. That is, Excel provides no method to save the contents of the clipboard to a file.
EAN: 2147483647
Pages: 134