Section 6.5. Macros
6.5. MacrosVisual Basic does not play a big part in this application. It is used for navigation, managing the item and date selections, and creating the anomaly report. All the code is in a code module and is run by buttons on various sheets. These two macros control the items selection. Sub NextItem( ) If Range("settings!b7").Value >= Range("LastColumn").Value - 1 Then Range("settings!b7").Value = 1 Else Range("settings!b7").Value = Range("settings!b7").Value + 1 End If End Sub Sub PreviousItem( ) If Range("settings!b7").Value <= 1 Then Range("settings!b7").Value = Range("LastColumn").Value - 1 Else Range("settings!b7").Value = Range("settings!b7").Value - 1 End If End Sub A number representing the current item selection is in cell settings!B7. If this number changes so does the selected item. The number can have any value from 1 to LastColumn - 1. Remember, the first column is used for the dates. The NextItem subroutine checks to see if the current selection is the last column. If so, it sets the selection to the first column, otherwise it adds one to the number in B7 to select the next column. The PreviousItem subroutine works the same way except it moves in the other direction. A number representing the selected row/date is in cell settings!B16. There are two similar macros that control the date selection. This is the code: Sub NextDay( ) If Range("settings!b16").Value >= Range("LastRow").Value - 25 Then Range("settings!b16").Value = 1 Else Range("settings!b16").Value = Range("settings!b16").Value + 1 End If End Sub Sub PreviousDay( ) If Range("settings!b16").Value <= 1 Then Range("settings!b16").Value = Range("LastRow").Value - 25 Else Range("settings!b16").Value = Range("settings!b16").Value - 1 End If End Sub The only difference is that we need to start with the date that is 35 days before the selected date to include the historical data the model needs. These selections can also be changed using the combo box controls , so the macros are designed to match the results from the controls. The date selection macro changes the value in cell settings!B16. The combo box that allows the user to select a date is formatted as shown in Figure 6-24. Figure 6-24. Formatting the combo box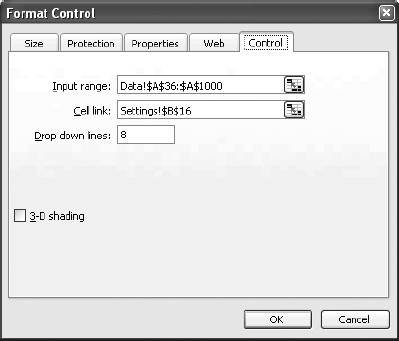 The link cell is settings!B16. The combo boxes and the macros do the same thing but give the user different options. This is the macro that produces the anomaly report: Sub RunDay( ) Dim oldcol, Outline, x As Integer ' We are going to run through all the items. At the ' end we want to return to the item that was selected. ' So we need to save the current column number oldcol = Range("settings!b7").Value ' The next step is to clear all information ' that is on the report sheet. ' Go to the Report sheet Sheets("Report").Select ' Clear the data area. Rows above 4 are headings. ' There cannot be more than 255 items since there ' are only 255 columns in a worksheet. ' We clear rather than delete ' because this preserves all ' the formatting. Range("a4:f259").ClearContents ' Put the sensitivity heading in cell B1 Range("B1").Value = "SENSITIVITY = " & Trim(Str((Range("sen").Value * 100))) & "%" 'Outline is a line counter. It starts at 3 ' because we add 1 to it each time we ' add a line to the report and this ' way it will start with row 4. Outline = 3 ' Now we are ready to check each item for the ' current day. We change the item by changing the ' value in cell settings!B7. ' Here we set up a loop to check each item For x = 1 To Range("LastColumn").Value - 1 ' Minus 1 because the first column ' has the dates ' Change the item setting Range("settings!b7").Value = x ' When B7 changes the entire application recalculates ' If the item is out of the control limits, the named value ' isout will be a 1. ' Test isout to see if it is 1 If Range("isout").Value = 1 Then ' If it is add 1 to the line counter Outline = Outline + 1 ' Now we fill in columns A-F on row Outline with ' the report information ' The name of the item Range("report!A" & Outline).Value = Range("workarea!h2").Value ' The predicted value Range("report!B" & Outline).Value = Range("workarea!q37").Value ' The actual value Range("report!C" & Outline).Value = Range("workarea!h37").Value ' The error (predicted - actual) Range("report!D" & Outline).Value = Range("workarea!q37").Value - Range ("workarea!h37").Value ' The number of standard deviations the error represents ' workarea!T6 is the standard deviation or errors Range("report!E" & Outline).Value = Range("report!D" & Outline).Value / Range("workarea!t6").Value ' The percentage of error amount that would be less than the ' current error in a normal distribution. Effectively this is ' the probability that today's values for the item being tested ' is an anomaly Range("report!f" & Outline).Value = Range("workarea!t15").Value End If Next x ' End the loop ' Select the top left cell of the report sheet Range("A1").Select ' Reselect the original item Range("settings!b7").Value = oldcol End Sub This subroutine stays on the report sheet, so it is not necessary to turn off screen updating. The rest of the code is pure navigation, like this macro: Sub GoDisplay( ) Sheets("Display").Select End Sub This is run by all of the Back buttons and returns the user to the main display. |
EAN: 2147483647
Pages: 101