Section 4.6. Analyzing the Results
4.6. Analyzing the ResultsTo see if the model is working, we rank the dogs by their scores and only consider half of them, the ones with the highest scores. The mid-point is not likely to be the best threshold, and we will want to experiment with different splits. So, the sheet shown in Figure 4-23 is set up to allow different percentages to be tested. The number 50 is entered in cell L1. This indicates that we are going to test a 50% split. In cell L2, we calculate how many of the 449 model dogs are in the top half. The formula is =INT(450*(L1/100)). The result is 225. Figure 4-22. Model with scores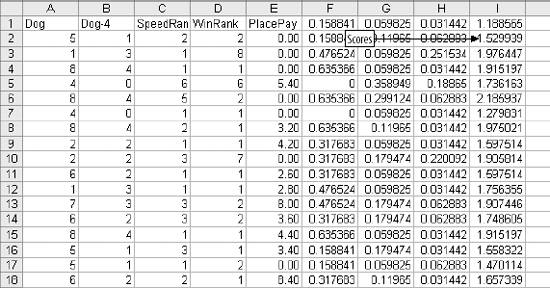 Figure 4-23. Test setup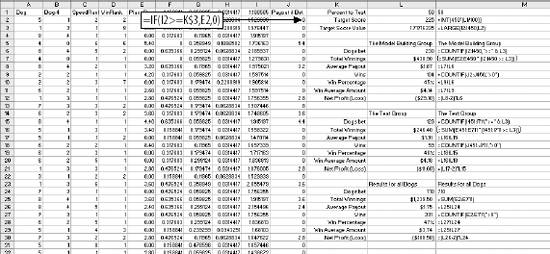 The threshold for this test is the 225th highest score. The formula in L3 is =LARGE(I2:I450,L2). This gives the value we need. With these formulas in place we can easily test any percentage. If we enter 15 in cell L1, the value in L3 gives us the value to test the top 15%. In the range L6:L12 are details of the model's performance for the top 449 rows. The first formula is =COUNTIF(I2:I450,">=" & L3). This counts the number of scores equal to or greater than the threshold. It tells how many bets we make if we bet the top half of the scores. In column J, the formula =IF(I2>=L$3,E2,0) gives the payout for each dog. If the dog's score is less than the threshold, it is not bet and the payout is zero. To get the total payout for the model group, we use the formula =SUM(J2:J450) in cell L7. We get the average payout by dividing L7 by L6. In this case it is $1.87 in cell L8. The number of wining bets is calculated in cell L9 using =COUNTIF(J2:J450,">0"). The win rate, the percentage of bets that win, is in L10. The formula is =L9/L6. We also want to know the average amount of a winning payout. We get it with =L7/L9 in L11. Finally, the formula =(L8-2)*L6 in cell L12 gives the total profit or loss for the 449 model dogs. We subtract 2 because the bet is $2.00 and we are interested in the profit. The same details for the test group are in the range L15:L21. We can now compare the performance of the model group and the test group. If they are not similar, the model may be over-trained. To test the effectiveness of the model we need to see how it compares to the whole population. In cells L24:L30 we calculate the same details for all dogs. The formulas in this area are a little different because we do not consider the threshold in this area. Here we want to see what would happen if we just bet all the dogs. In Figure 4-24 we consider the results. In Item 1 the average payout for all dogs is $1.75, but for the top 50% scores the results are better. The model group paid out $1.87 and for the test group it was $1.91. This is good news for two reasons. It suggests that the model is working and that it is not over-trained. Item 2 shows that the percentage of wins is a bit lower for the dogs in the top 50%. This is probably because the model is finding the dogs with higher payouts. Item 3 shows this clearly. The average amount paid for a winner is $3.74 overall, but for the top scoring dogs it is above $4.00. The model works, but is not profitable at 50%. The next step is to find a profitable threshold. We started with tens of thousands of rows, but now we are down to a modest amount of information. We know the model is capable of making good predictions and there is no evidence of over-training. We need to know how the model's performance changes as we change the threshold. We test this by changing the value in cell L1. Starting with 50 and working down to 5 in steps of 5, we build Figure 4-25. Item 1 is the threshold being tested. The Profit/Loss amounts for both groups are added together (Item 2), building an area to populate a chart. We add the amount together because the groups are small. At the 5% threshold there are only three wins in the test group. Figure 4-24. Results at 50%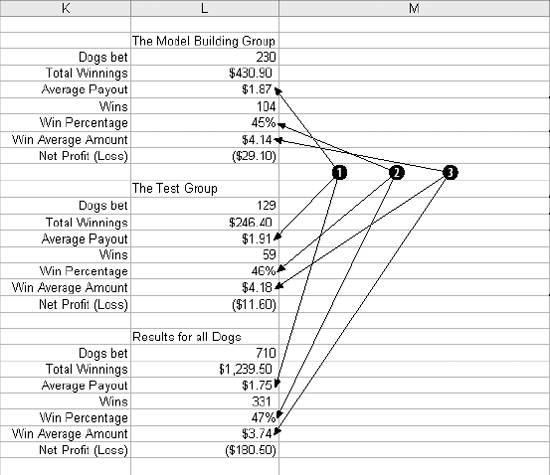 Figure 4-25. Finding the threshold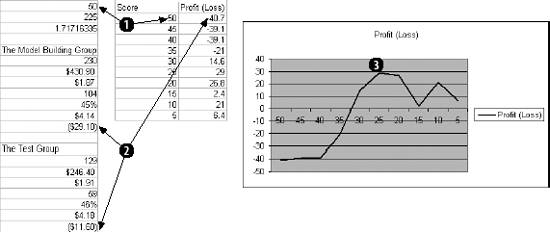 In Item 3 we can see the overall shape of the curve. The profit tops out at about 25%, and that is probably the best threshold for the model. |
EAN: 2147483647
Pages: 101