Management of Analysis Services Storage
One of the main reasons for using Analysis Services centers on performance with complex data retrieval. The design of the storage within Analysis Services, therefore, becomes very important when trying to achieve the query and processing performance expected. In order to understand storage design, we'll first review what modes of storage are available within Analysis Services. Next, we will look at the configuration of partitions. Last, we will explain how to design aggregations.
Storage Modes
Analysis Services permits configuring dimensions and measure groups using the following storage modes: Multidimensional OLAP (MOLAP), Relational OLAP (ROLAP), and Hybrid OLAP (HOLAP).
Multidimensional OLAP
MOLAP storage mode is the most aggressive because it stores all the aggregations and a copy of the source data with the structure. Additionally, the structure stores the metadata required to understand the structure. The real benefit of this structure is query performance, as all information needed to respond to queries is available without having to access the source data. Periodic processing is required to update the data stored within the structure, and this processing can be either incremental or full. As a result, data latency is introduced with this storage mode. Also as a result of this structure, storage requirements become much more important due to the volume of information that the system requires.
Relational OLAP
Indexed views within the data source of the ROLAP structure store the aggregations, while a copy of the source data is not stored within Analysis Service. With this mode, any queries that the query cache cannot answer must be passed on to the data source. This makes this storage mode slower than MOLAP or HOLAP. The real benefit is that users can view data in real or near-real time, and because a copy of the source data is not being stored within the structure, the storage requirements are lower.
Hybrid OLAP
As you might have guessed, the HOLAP storage mode is a combination of multidimensional OLAP and relational OLAP. This storage mode stores aggregations but does not store a copy of the source data. As a result, queries that access the aggregated values will perform well, but those that do not will perform slower. Also as a result, this storage mode requires far less storage space.
Partition Configuration
When you are tasked with configuring partitions for your cubes, you have two primary activities. First, you have the configuration of the storage of the partition, and second you have the optimization of the partition by configuring aggregations. The storage options, which were previously discussed, include MOLAP, HOLAP, or ROLAP. Aggregations are precalculated summaries of data primarily employed so that query response time is made faster because the cube partition has prepared and saved the data in advance of its use.
You should understand that the configuration of storage in Analysis Services is configured separately for each partition of each measure group in a cube. This enables you to optimize your cube query strategies for each partition. An example would be to keep the current year's data in one partition optimized for more detailed and narrow queries, while keeping older data in another partition optimized for broader aggregated queries.
You configure your cube storage using either Business Intelligence Developer Studio or, after deployment, using Management Studio. Often, it is not necessary for developers to be involved with partitioning or configuration of storage, so this is a better fit for being done using Management Studio. The downside is that the Visual Studio project will not be updated to reflect the current storage settings, and you must be very careful during deployment that your selections made in Management Studio are not overwritten. Specifically, you will want to ensure that during deployment, when the Specify Options for Partitions and Roles page is displayed, you indicate that Partitions and Security should be maintained on the deployment target database and thus not overwritten by this deployment (see Figure 7-5).
When you deploy a cube for the first time, a measure group is set up to be entirely contained within a single partition, spanning the entire fact table used for the measures. With the Enterprise Edition, you can change that to define multiple partitions by setting the StorageMode property for each partition.
Here's how you can set the storage options in SQL Server Management Studio:
-
Open Management Studio and connect to the target Analysis Services server.
-
In Object Explorer, open the cube that contains the partition for which you want to set storage options. If you have more than one partition, right-click a partition and click Properties; otherwise, right-click a cube, and then click Properties.
-
In the Partition Properties (or Cube Properties) dialog box, select the Proactive Caching page.
-
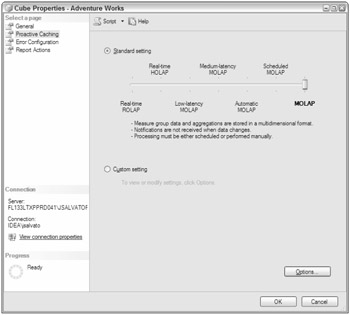
On the Proactive Caching page, select the Standard setting radio button to accept the default storage settings for the storage type specified by the slider bar. Now you may move the slider bar to change the storage type from MOLAP to HOLAP and to ROLAP (see Figure 7-17).
-
Optionally, you may select the Custom setting checkbox, and then click Options to set advanced storage options.

Figure 7-17
Designing Aggregations
Again, the primary role of aggregations is to precalculate summaries of the cube data so that user queries may be answered very fast. When a query is unable to use an aggregation, Analysis Services must query the lowest level of details it has stored and sum the values. Aggregations are stored in a cube in cells at the intersection of the selected dimensions.
Designing aggregations is all about tradeoffs between space and user performance. Additionally, optimizing query performance via aggregations also increases the time it takes to process the cube. When you have few aggregations, the time required to process the cube and the storage space occupied by the cube is rather small, but the query response time may be slow because the query cannot leverage a precomputed summary (aggregate) and must instead rely upon having to retrieve data from the lowest levels within the cube and summarize at query time.
You design aggregations by determining which combination of attributes are often used by queries and could benefit from precalculation. You can begin this process by using either the Aggregation Design Wizard, or after deployment you can use query usage statistics in conjunction with the Usage-Based Optimization Wizard. These methods obviously lend themselves to specific lifecycle usage. Developers would likely use the Aggregation Design Wizard to initially configure the aggregations prior to deployment, while administrators would opt for using the query statistics and the Usage-Based Optimization Wizard.
A good rule of thumb to start with is to optimize at a level of 20/80 and 80/20. When using the Aggregation Design Wizard, you are really not sure what the usage patterns will be, so optimizing to higher than a 20-percent performance increase would not be valuable. On the other hand, when you have actual query statistics that clearly represent production usage patterns, you should optimize at about an 80-percent performance increase level. This in effect states that you want 80 percent of user queries to be answered directly from aggregations.
Details of the Aggregation Design Wizard will not be reviewed, as we assume that most administration of the aggregations will be performed in either Management Studio or BIDS using Usage-Based Optimization.
Before using the Usage-Based Optimization Wizard, you need to ensure that the query log is enabled and that it has been populated. You enable this log in Management Studio via the Analysis Services Server properties. The CreateQueryLogTable setting enables logging to a database table when true, while the QueryLogConnectionString specifies the database in which the logging will be stored. Also, you need to note the setting of the QueryLogSampling, as this determines which queries will get logged.
Once the Query Log has been enabled and is populated with query statistics, you can run the Usage-Based Optimization Wizard. Here are the steps needed to use this wizard:
-
Open Management Studio and connect to the target Analysis Services server.
-
Select the desired database, cube, and measure group.
-
Right-click the partitions folder and select Usage Based Optimization.
-
On the Select Partitions to Modify dialog, specify any partitions that are to be evaluated. You can either select all partitions for the measure group or you can select combinations of individual partitions.
-
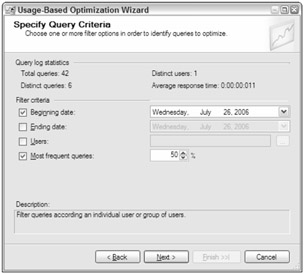
On the Specify Query Criteria dialog, you can view query statistics for the selected measure group partition, including the total number of queries and the average response time for processing the queries. Optionally, you can set some limits to filter the queries that you would like the optimization to consider (see Figure 7-18) including an interesting option for filtering the queries by Users. Presumably, one notable use of this option could be to enable you to make sure your executives' queries are delivering the best response time.
-
On the Review the Queries that will be Optimized dialog, you can view the specific dimension member combinations under the client request column, the occurrences of those combinations, and the average duration of those combinations. At this point, you also have a column of checkboxes beside each row that allows you to indicate that you do not want some of the suggested queries optimized.
-
On the Specify Storage and Cashing Options dialog, you can use the slider to change form MOLAP to HOLAP and to ROLAP.
-
Next, you specify the counts of various cube objects on the Specify Object Counts dialog.
-
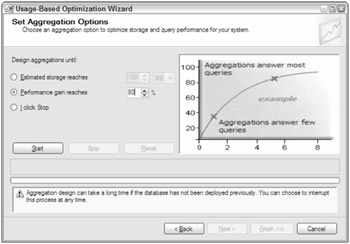
Next, on the Set Aggregations Options dialog, you specify how long the aggregations should be designed. Options to consider include designing aggregations until a specified amount of storage has been used, until a specified percentage of performance gain has been reached or until you decide to stop the optimization process (see Figure 7-19). Because you are basing this optimization on real query statistics, you should consider optimizing until a performance gain of about 80 percent has been attained. This translates loosely to optimizing 80 percent of the queries to use the aggregations.
-
Last, we are presented with the Completing the Wizard dialog that you may use to review the partitions affected by the aggregation design and also to indicate whether or not you would like the effected partitions to be processed immediately.

Figure 7-18

Figure 7-19
You now have completed designing the storage of your Analysis Services cubes, set up partitions, and designed aggregations. Next, we need to review how to apply security to Analysis Services.
EAN: 2147483647
Pages: 193