4 Millimeter wave indoor LAN
4 Millimeter wave indoor LAN
4.1 Introduction
In recent years , the increasing use of processing applications with high data speed exchanges have involved an important development of the local area networks (LAN). At the same time, the progress of wireless communication systems lead to development of WLAN which are very attractive because of their layout flexibility and the portability of their terminals. Currently, the two most advanced standards (Hiperlan 2 and IEEE 802.11) working at frequencies of about 2, 4 or 5 GHz offer data rates of about 20 and 50 Mbit/s that remain lower than those for cable networks. In order to exceed these limits and to reach data rates higher than 100 Mb/s, the 60 GHz band is currently studied. Indeed, this frequency band is particularly adapted to local area networks. The strong attenuation of the waves at this frequency ensures relative safety between rooms and the outside. That makes possible to employ limited cells by partition of the rooms and facilitate the engineering deployment. The low dimension of the antennas working at 60 GHz is also an advantage compared with lower frequencies. Moreover, the available bandwidth at 60 GHz is a major asset compared to the other lower frequencies and makes possible to reach rates higher than 100 Mb/s.
4.2 Study of the propagation channel
Because of the multipaths (multiple reflections from the ground, the walls, furniture etc), the received signal is composed of several differently attenuated and delayed components. This behaviour is translated in the frequency field by a different selectivity from the various spectral components of the propagation channel that behaves like a selective filter with regard to frequency. It is thus necessary to optimise the system according to the propagation conditions.
The deployment of a wireless indoor system must thus obey two major constraints:
-
To ensure a controlled radio coverage of the building in order to optimise the use of the frequency band and the cost of the infrastructure.
-
To know the selectivity of the channel, which allows the optimisation the system parameters (modulation, coding etc) in order to reach the target rate with a minimal error rate. The preliminary estimation of the characteristies of data rates and error rates attached to the services envisaged is an essential stage.
4.3 Statistical study of the channel of propagation
The first stage consists in knowing how to establish a link budget of typical connection according to the distance transmitter-receiver and the environment. The statistical study of the channel was carried out from measurements taken in various kinds of environments: offices for the R-LAN and residential, for home applications (multimedia).
Line of sight (LOS) measurements carried out (Figure 13.3) present a decrease that is proportional to the logarithm of the distance. On the other hand, in the none line of sight (NLOS) conditions this loss law in function of the distance is not respected (Figure 13.4).
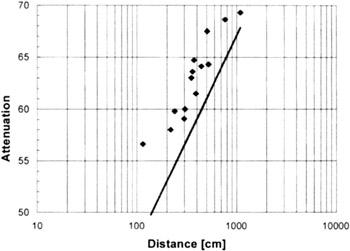
Figure 13.3: Propagation loss in LOS condition [GUILET, 2001]
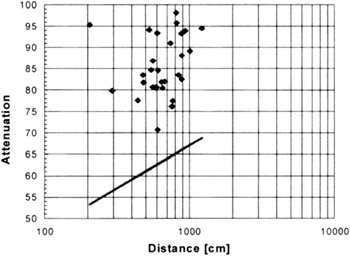
Figure 13.4: Propagation loss in NLOS condition [GUILET, 2001]
On the other hand, taking into account the number of crossed partitions gives the significant results. Figure 13.5 presents the additional loss measured compared to that of free space as a function of the number of crossed partitions. The values are, for a partition (plasterboard), about 19 dB and of 27 dB for two partitions. These high values show that a propagation model integrating the number of crossed partitions will be better.
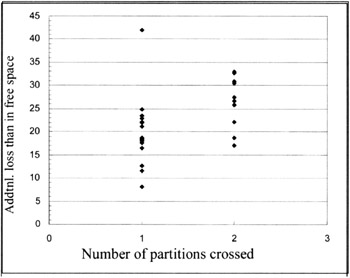
Figure 13.5: Influence of the number of partitions crossed by the direct path on the propagation loss [1]
The estimated link budget cannot thus be only based on the direct path but needs to take into account additional elements such as the interior architectures and the propagation phenomena (reflection, transmission, diffraction ) that a ray model, based on geometrical optics, can simulate.
4.4 The propagation model
Modelling the propagation at 60 GHz in an indoor environment has two distinct interests:
-
To help to deploy and to give a cost estimate of the coverage for such systems implemented in different environments.
-
To generate a channel model that can be used in the transmission-simulated system and allows an optimisation of the parameter setting of the system.
A 3D ray-tracing model has been developed and adjusted at 60 GHz for an indoor environment, coverage examples for different heights of reception (antennas on PC, in height) are described in Figure 13.6.
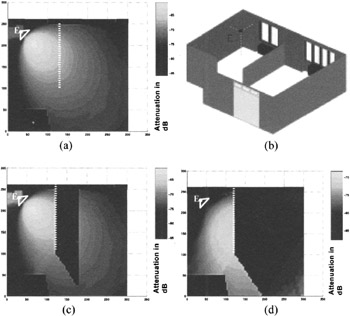
Figure 13.6: Radio coverage with 2m (a), 1.5m (c) and 0.5m (d) above the ground for the configuration
A study of the model parameters allows optimisation of the number of reflections to be calculated to simulate the indoor propagation at 60 GHz [CHAIGNEAUD, 2001]. From this tool, a propagation channel model can be generated in order to test various configurations of link without having to realise the corresponding measurements.
4.5 System study
The simulated system study was realised in synergy with the characterisation of the channel in order to adapt the system to the propagation conditions in this band. The objective is to define the physical layer most adapted to reach data rates higher than 120 Mb/s.
4.5.1 Multi- carriers techniques
The techniques of multi-carrier transmissions like COFDM were developed for different wireless systems such as DAB, HIPERLAN different multi-carrier techniques were used to evaluate the performances of the physical layer for the 60 GHz RLANs systems. MC-CDMA techniques initiated in 1993, were confronted with COFDM modulations. MC-CDMA, in particular, allows one to combine the advantages of COFDM modulations (multipaths robustness) with the spread spectrum techniques (high capacity). On the other hand, it increases the complexity of the receiver.
4.5.2 Results
The first results in a multi-carries configuration in "offices" and "residential" environments are promising in spite of the un-optimised parameter setting. The results in Figure 13.7 represent the error rate obtained according to the useful bit energy proportional to the system's signal to noise ratio. These curves were simulated for two configurations:
-
LOS: Transmitter and receiver are of visibility.
-
NLOS: Transmitter and receiver are masked by one or more elements of interior architecture (partition, movable, carries..).
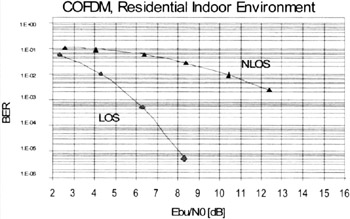
Figure 13.7: Evaluation of the error rate according to various favourable and unfavourable positions in residential environment [SIAUD, 2001]
For each of these configurations (LOS and NLOS), the tests were made with "typical" files corresponding to the propagation channel having some average wideband characteristics. These first results show that for an error rate of 10 ˆ’ 2 , a signal-to-noise ratio needs to be twice more powerful in none-visibility (NLOS) than in visibility (LOS). Optimisation of parameter setting of the COFDM chain in progress will allow improvement of these results. Moreover, it appears starting from the first curves, that the use of multi-input/output techniques in none-visibility is to be considered .
The degradation induced by RF stages is particularly penalizing in the COFDM modulation, and the need to evaluate a broad panel of system solutions resulted in also studying mono-carrier solutions integrating the algorithms of turbo-equalisation in reception [HELARD, 2001].
EAN: 2147483647
Pages: 191