APPENDIX
|
|
Exhibit 1: Beer Supply Chain
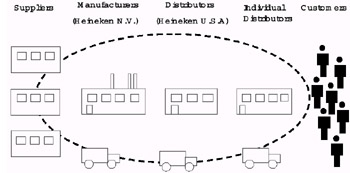
Exhibit 2: Old Distribution Process
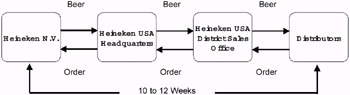
Exhibit 3: New Distribution Process
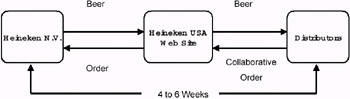
Exhibit 4: Benefits from HOPS
| Benefits | |
|---|---|
| Benefits to Supplier | Lead Time Reduction |
| Benefits to Customer | Procurement Cost Reduction |
Exhibit 5: Net Profit of Heineken 1997–2000[3]
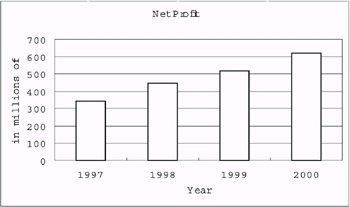
Exhibit 6: Per Capita Expenditure on Beer 1995–2000[4]
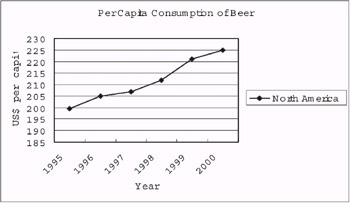
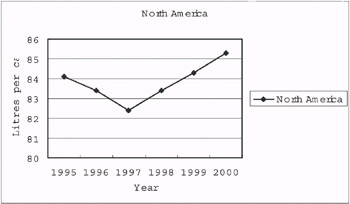
Exhibit 7: Per Capita Consumption of Beer 1995–2000[4]
[3]Source: http://WWW.Heineken.com
[4]Source: http://WWW.Euromonitor.com
|
|
SQL Tips & Techniques (Miscellaneous)
ISBN: B001KZAZTK
EAN: 2147483647
EAN: 2147483647
Year: 2005
Pages: 367
Pages: 367
Authors: Konrad King, Kris Jamsa