The Graphs button on the Assign Resources dialog provides you access to graphical reports about the selected resources work on the project. There are three different graphs to choose: Work, Assignment Work, and Remaining Availability. We will cover only the latter two graphs because the Assignment Work graph provides all the same data as the Work graph, but with extra information such as a line that represents the availability of the resource. These graphs are great because they give you access to graphical information about the workload of the selected resource even before you assign it to the selected task. This way, you can avoid overallocations before they even start.
Using Assignment Work Graphs
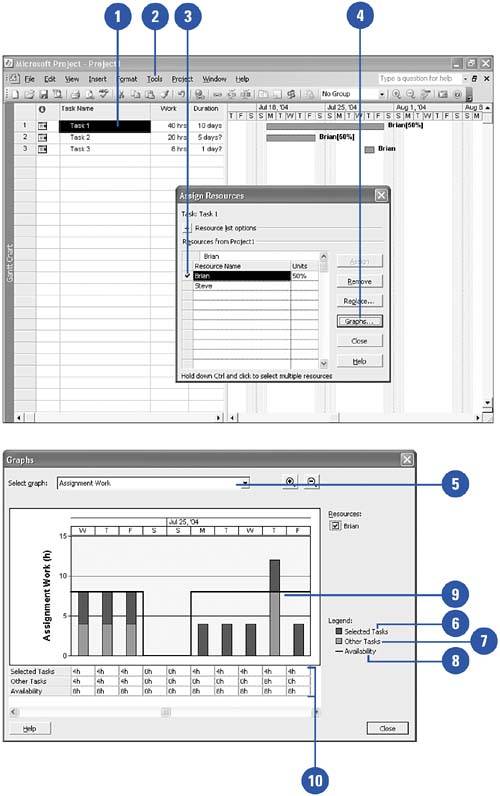
Select a task.
Click Tools, Assign Resources.
From the Assign Resources dialog, select the resource for which you want to see graphs.
Click the Graphs button.
Make sure the Select Graph drop-down list is set to Assignment Work.
Purple sections of the graph represent the hours assigned to the selected resource for the currently selected task(s).
Blue sections represent work assigned to all the other tasks in the project assigned to the selected resource.
The black line shows the number of hours of availability for the resource. This represents what a 100% assignment would be for the given time period.
Any bar that goes over the black line shows an overallocation . This means that you will need to either move some tasks, reduce the work on the tasks, or get the resource to work overtime.
The table shown here lists the breakdown of selected task work, other task work, and availability that correspond to the graph bars.
Using Remaining Availability Graphs
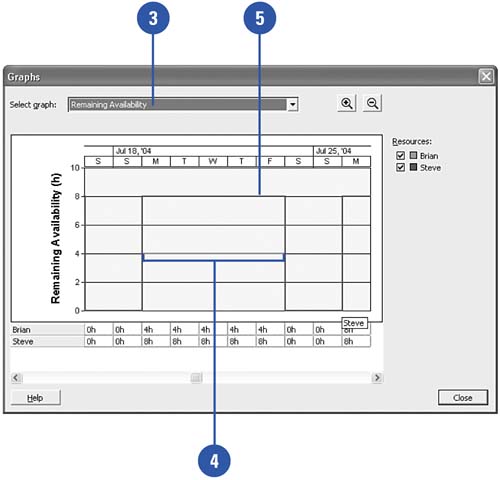
Select a task and click Tools, Assign Resources.
Select two or more resources and Click the Graphs button on the Assign Resource dialog.
Select Remaining Availability from the Select Graph drop-down list.
Brian's remaining availability of 4 hours is represented here by a blue line.
Steve's remaining availability of 8 hours for the same time period is shown in purple.
For Your Information
Hiding Resource Information in the Graphs Dialog
Each resource name in the Graphs dialog has a check box next to it. When working with graphs in which you've selected many resources, reading the graph can be confusing. Unchecking some of the resources hides their graph information from the graph, making it easier to read and find specific information. You can then add resources back in to see the effect on the graph.