| Usage views are views that have a table (sheet) on the left side of the screen and a timescaled grid on the right side. This timescaled grid can contain a number of fields, such as Work, Actual Work, Cost, and so on that will all be broken down across time. This way, you do not have to rely just on the fact that Task X cost $500 total. You can see how much of the $500 fell into each week of the task's duration. These views are a very important tool for the project manager, as they give him the ability to view detailed data about how data is lining up across time. There are two basic types of Usage views: Task Usage and Resource Usage. Working with the Task Usage View -
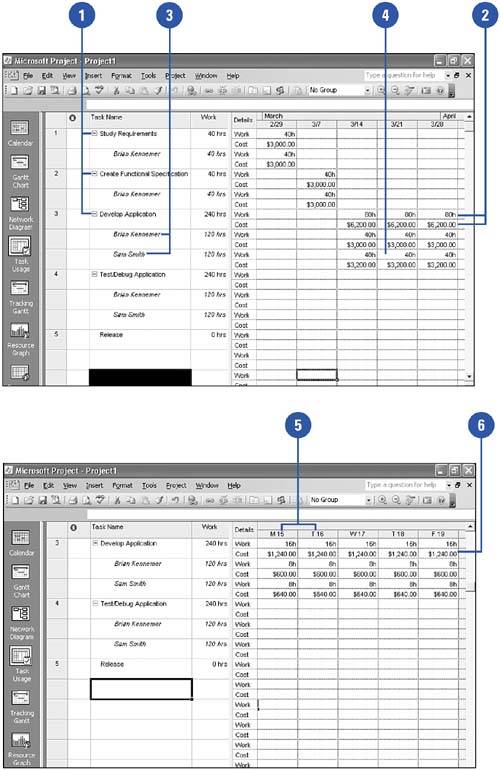
 In a Task Usage view, the names of the tasks are at the top of the hierarchy. In a Task Usage view, the names of the tasks are at the top of the hierarchy.
-
 Reading across to the right, you can see the task data. In the example, you can see that the task named Develop Application will cost $6,200 per week and require 80 hours of work per week. Reading across to the right, you can see the task data. In the example, you can see that the task named Develop Application will cost $6,200 per week and require 80 hours of work per week.
-
 Indented beneath the task names are the names of the resources assigned to do the work on that task. Develop Application has two resources assigned. Indented beneath the task names are the names of the resources assigned to do the work on that task. Develop Application has two resources assigned.
-
 If you read across, you can see the Work and Cost data for each of the two resources and how they roll up to the Work and Cost data for the task. If you read across, you can see the Work and Cost data for each of the two resources and how they roll up to the Work and Cost data for the task.
-
 You can adjust the timescale to fit your viewing needs. Here we have changed the timescale from Weeks to Days. You can adjust the timescale to fit your viewing needs. Here we have changed the timescale from Weeks to Days.
-
 Project has taken the $6,200 per week figure and broken it down into the five working days in the week and shows it as $1,240 per day. Using these features, a project manager can get precise data about a project. Project has taken the $6,200 per week figure and broken it down into the five working days in the week and shows it as $1,240 per day. Using these features, a project manager can get precise data about a project.
 Displaying the Resource Usage View - You can display the Resource Usage view by clicking View, Resource Usage.
- You can also use the View bar by clicking the Down control on the View bar until you can see the Resource Usage view.
- Click on the Resource Usage view.
 Working with the Resource Usage View - The Resource Usage view shows resource names first. Read to the right to get timescaled data pertaining to the resource.
- Indented under the resource names are the names of tasks to which the resource is assigned.
- To the right of each resource is timescaled data about these individual assignments.
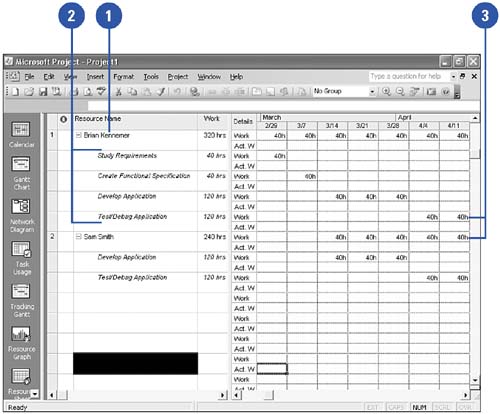 For Your Information Resource Usage View Layout The Resource Usage view is laid out in the same fashion as the Task Usage view, except for one key difference: The position of the tasks and resources are switched so that the resource name is at the top of the hierarchy. This allows the project manager to view the same kinds of timescaled data, as is possible in the Task Usage view, but from a different angle: the angle of resources, instead of tasks. This type of view is best used when trying to see how many tasks and how much work is being assigned to each resource, and how that work breaks down across time. |
|