| Custom reports come in four basic types: task, resource, monthly calendar, and crosstab. Task and resource reports are essentially the same format, differing only in what kind of data is displayed (task or resource). Monthly calendar reports show tasks drawn on a calendar form that looks essentially like the Calendar view does onscreen. Crosstab reports look like a Task or Resource Usage view with task and resource names down the left side and a timescale across the top of the page with the data fields you choose in the middle. The Details tabs for the task and resource reports conform exactly to the descriptions in the "Report Details" sidebar. Crosstab reports have a dialog that has the same tabs as the task and resource reports, but they contain different controls. The monthly calendar report has a completely different dialog for setting its configuration. Monthly Calendar -
Name ”  This option defines the name for the report. It is a good idea to put the type of report in the name of your custom report, making it easy to find the right one quickly. This option defines the name for the report. It is a good idea to put the type of report in the name of your custom report, making it easy to find the right one quickly. -
Filter ”  As with the other types of reports, you can define which tasks should appear in this report. As with the other types of reports, you can define which tasks should appear in this report. -
Calendar ”  You can choose which calendar should be used when printing this report. You can choose which calendar should be used when printing this report. -
Gray Nonworking Days ”  This option defines whether days defined as nonworking should be shown in gray in the report. This option defines whether days defined as nonworking should be shown in gray in the report. -
Solid Bar Breaks ”  This option tells Project whether the end of a task bar for a task that spans weeks should be drawn with a dotted line (if the option is unchecked) or with a solid line (if the option is checked). Displaying the bar end with a dotted line can be helpful because it makes it visually clear which tasks span weeks. This option tells Project whether the end of a task bar for a task that spans weeks should be drawn with a dotted line (if the option is unchecked) or with a solid line (if the option is checked). Displaying the bar end with a dotted line can be helpful because it makes it visually clear which tasks span weeks. -
Print Gray Bands ”  This option tells Project to draw a gray band between dates for which tasks had to be printed on a separate page. The report can only show bars for four tasks on any given day, so sometimes Project must print tasks on a separate page. This option controls how these pages will be formatted. This option tells Project to draw a gray band between dates for which tasks had to be printed on a separate page. The report can only show bars for four tasks on any given day, so sometimes Project must print tasks on a separate page. This option controls how these pages will be formatted. -
Show Tasks As ”  This option lets you decide whether tasks are drawn as bars, lines, or just start and finish dates. It should be noted that if you choose to see lines, Project displays seven tasks in any given day rather than the four-task limit of the bar display. This option lets you decide whether tasks are drawn as bars, lines, or just start and finish dates. It should be noted that if you choose to see lines, Project displays seven tasks in any given day rather than the four-task limit of the bar display. -
Label Tasks With ”  This option lets you decide whether Project should include the ID, Name, and/or Duration values for each task. This option lets you decide whether Project should include the ID, Name, and/or Duration values for each task. 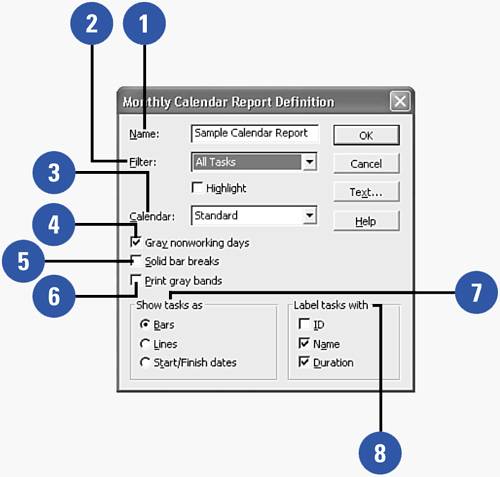 Crosstab Reports -
Name ” This option defines the name for the report. It is a good idea to put the type of report in the name of your custom report, making it easy to find the right one quickly. -
Row ” You can choose from either Task or Resource. Crosstab reports are just like Usage views. If the And Task\Resource Assignments option is checked, they show tasks or resources, along with an indented list of the assignments for the listed tasks or resources. If you choose Task, you will have a crosstab report that looks like the Task Usage view. If you select Resource, you will have a crosstab report resembling the Resource Usage view. -
Column ” This option lets you define the time units that will be used to display data. -
Data Area ” Pick the field you want displayed in your report. -
And Task\Resource Assignments ” With this box checked, you will have a report that looks like a Usage view. With this box unchecked, the report shows only the task- or resource-level information. -
Filter ” This option selects the filter for the report. 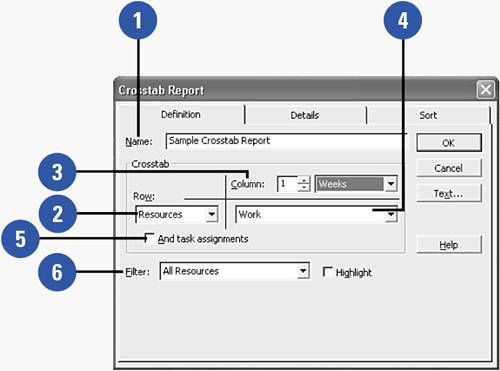 |