After you have established baseline data in your plan, you will need to be able to use it to analyze your progress.
Viewing Baselines In the Tracking Gantt
Save your baseline using the steps described in the previous tasks .
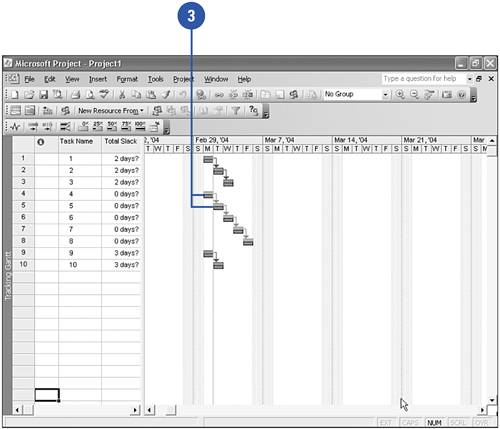
Click the View, Tracking Gantt menu item.
Notice the dark bars below the "normal" Gantt bars. These dark bars represent the baseline start\finish dates.
Using the Multiple Gantt Chart View
Click the View, More Views menu item.
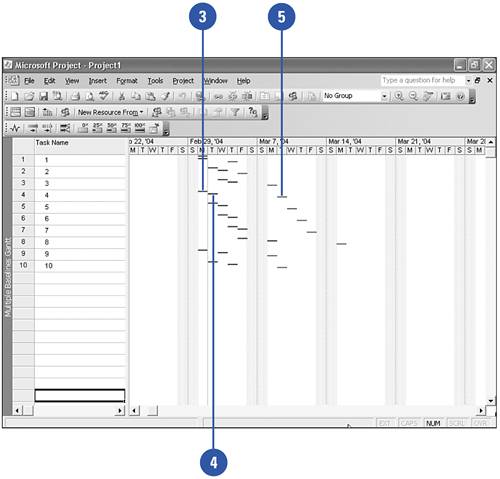
Select Multiple Baseline Gantt from the list.
The baseline values are shown in blue.
Baseline1 values are colored in maroon.
Baseline2 values are colored in green.
Using this view, you can see the date-slipping trends across the times that baselines were saved.
Applying the Baseline Table to View Baseline Data
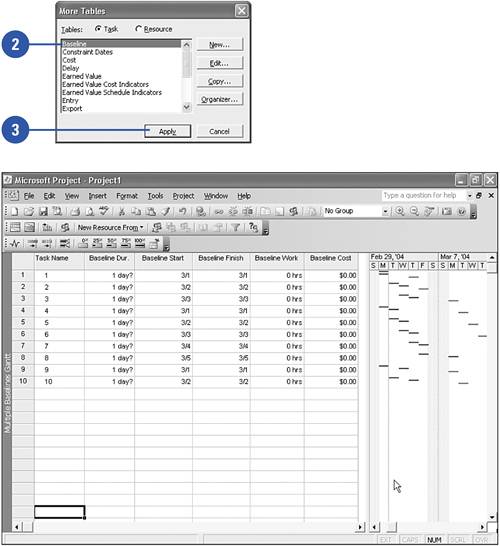
Click the View, Table, More Tables menu item.
Select Baseline.
Click Apply.
View your baseline data.
Did You Know?
Instead of having to insert baseline fields into your views, you can use the tracking table . The tracking table, which already comes with Project, already contains the Duration, Start, Finish, Work, and Cost fields for that baseline.