Getting a Visual Readout (Histogram) of Your Corrections
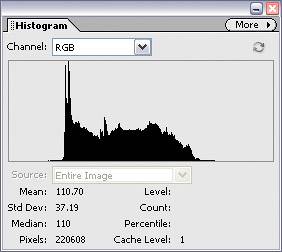
| In previous versions of Elements, there were two ways to see a histogram. (A histogram is a graph showing the tonal range of your photo.) You could either view it when using Levels, or you could open a dialog that would display a histogram. But you could only view it in this dialogit wasn't updated live as you made tonal adjustments. Starting in Elements 3.0, Adobe made the Histogram its own floating palette, so now you can have it open as you apply adjustments while in Standard Edit mode. Plus, it shows you before-and-after readings before you click the OK button in a tonal adjustment dialog, such as the Adjust Smart Fix dialog. Step One©SCOTT KELBY
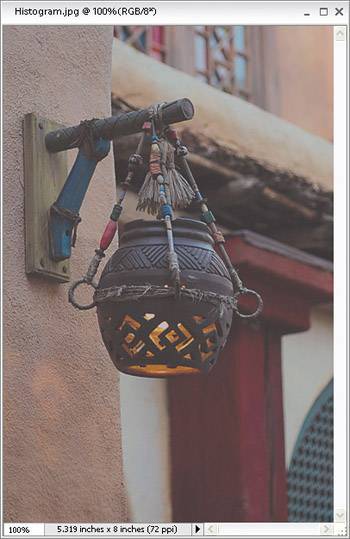
Open the photo that needs a tonal adjustment. Now, go under the Window menu and choose Histogram to open the Histogram palette. (By the way, this palette is only available in Elements 4.0's Standard Edit modenot in Quick Fix mode.) Step Two
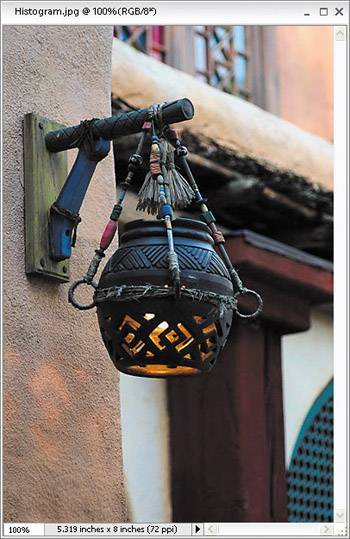
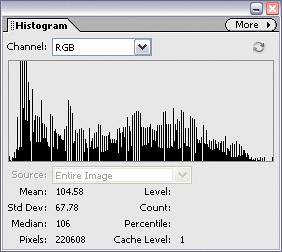
Go under the Enhance menu and choose Auto Color Correction. Take a look in the floating Histogram palette and you'll see how the Auto Color Correction command affected the photo's histogram. Note: If you see a small symbol in the upper right-hand corner of the graph that looks like a tiny yellow yield sign with an exclamation point in it, that's a warning that the histogram you're seeing is not a new histogramit's a previous histogram cached from memory. To see a fresh histogram, click directly on that warning symbol and a new reading will be generated based on your current adjustment. |
EAN: 2147483647
Pages: 201