Attaching the Profiler to a JVM
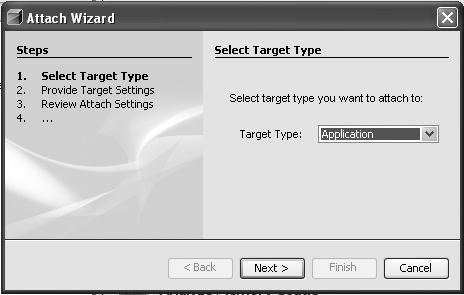
| The NetBeans Profiler can profile applications that are not started by the IDE. In other words, it can be attached to a JVM. To use this feature, select Profile | Attach Profiler. The Profiling Task dialog box is displayed with a list of projects at the top. To profile an application that does not have a corresponding project, select the <Global Attach> entry from the list and click Attach Wizard. This will start the Attach Wizard (shown in Figure 15-17). Figure 15-17. Attach Wizard dialog box The Attach Wizard will step you through the process of attaching the profiler to a JVM that was started from outside the IDE. The Attach Profiler feature can also be used to profile free-form web applications (those that are based on a build script created and maintained outside of the IDE). If your project is deployed to the Tomcat or Sun Java System Application Server, use the following steps to profile it:
If your free-form web application is deployed to another type of server, the Attach Wizard can modify the script used to start that server or it can provide documentation that shows you how to make the changes. To use the Attach Wizard for profiling a free-form web application, select the free-form project from the list of projects displayed at the top of the Profiling Task dialog box. When prompted by the Attach Wizard to select a Target Type, select J2EE Web/App Server. |
EAN: N/A
Pages: 279