Analyzing Memory Usage
| Use the Analyze Memory Usage feature to track the heap memory used by your application. If the JVM is reporting an OutOfMemoryError while running your application, then the profiler can help you determine the cause of the problem. When you click Analyze Memory Usage in the Select Profiling Task dialog box, the Analyze Memory Usage dialog box (shown in Figure 15-13) presents you with a choice: the profiler can track just object creation, or object creation and garbage collection. Figure 15-13. Analyze Memory Usage options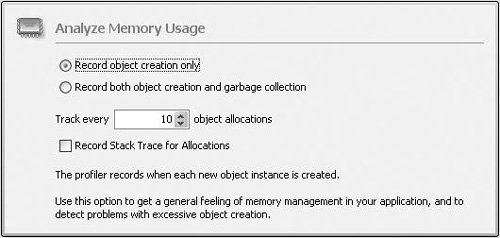 To get a general feel for object allocation, select object creation since it imposes less overhead. Statistics will be displayed that alert you to problems such as excessive object creation. To track down potential memory leaks, choose to record both object creation and garbage collection. For each class used by your application, only every tenth allocation will actually be tracked by the profiler. For most applications, this statistical approach dramatically lowers overhead without an impact on accuracy. You can use the spin control to change the number of allocations that are tracked, but keep in mind that lowering the value increases profiling overhead. In order for the profiler to report the methods that performed the allocations, you must select the Record Stack Trace for Allocations option. Viewing Live ResultsOnce profiling begins, you can use the Live Results button to open a dynamic display of the heap contents (shown in Figure 15-14). Figure 15-14. Live Results while analyzing memory usage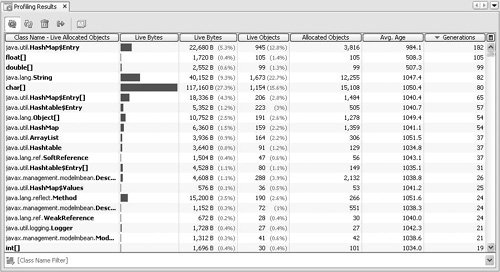 The columns displayed are:
To change the sort order, click a column header. This will sort the table in descending order using the values from the column. Click again to sort in ascending order. Sorting the table by Generations can frequently help identify classes that are the source of memory leaks. This is because an increasing value for Generations typically indicates a memory leak.
Taking a Snapshot of ResultsIn order to see which methods in your application are allocating objects, you must take a snapshot. Use the Take Snapshot button in the Profiler Control Panel or choose Profile | Take Snapshot of Collected Results. The resulting window has a tab labeled Memory Results which contains the same information as the Live Results window. Right-click a class and then select Show Allocation Stack Traces to switch to the Allocation Stack Traces tab. Its display is similar, only the first column displays method names (shown in Figure 15-15). Figure 15-15. Results snapshot while analyzing memory usage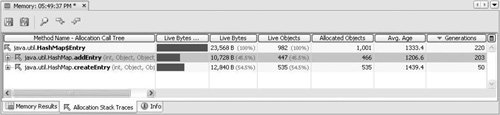
The listed methods allocated one or more instances of the selected class. You can use the displayed statistics to help narrow down which of the methods is allocating class instances that are causing memory leaks. In the example shown, the addEntry() and createEntry() methods are both allocating instances of HashMap$Entry. Note that the Generations value for the allocations done by addEntry() is much higher than that for createEntry(). This indicates that addEntry() is where leaking instances of HashMap$Entry are being allocated. You can click the icon next to a method to see the different execution paths that called that method (shown in Figure 15-16). Figure 15-16. Execution paths for a method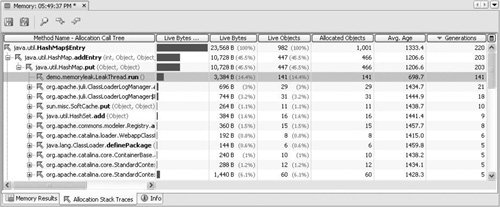 The addEntry() method was called by put(), which in turn was called by several different methods. The calls from one of those methods, LeakThread.run(), resulted in allocations with a very high Generations value, indicating that it is a likely source of a memory leak. It should be inspected to see if perhaps it is adding entries to a HashMap that are never being removed. |
EAN: N/A
Pages: 279