98.
9.2 State Minimization/Reduction
State reduction identifies and combines states that have equivalent "behavior." Two states have equivalent behavior if, for all input combinations, their outputs are the same and they change to the same or equivalent next states.For example, in Figure 9.1
(b), states S0 and S2 are equivalent. Both states output a 0; both change to S1 on a 1 and self-loop on a 0. Combining these into a single state leads to Figure 9.1(a). On all input strings, the output sequence of either state diagram is exactly the same. Algorithms for state reduction begin with the symbolic state transition table. First, we group together states that have the same state outputs
(Moore machine) or transition outputs (Mealy machine). These are potentially equivalent, since states cannot be equivalent if their outputs differ. Next, we examine the transitions to see if they go to the same next state for every input combination. If they do, the states are equivalent and we can combine them into a renamed new state. We then change all transitions into the newly combined states. We repeat the process until no additional states can be combined.
In the following two subsections, we examine alternative algorithms for state reduction: row matching and implication charts. The former is a good pencil-and-paper method, but does not always obtain the best reduced state table. Implication charts are more complex to use by hand, but they are easy to implement via computer and do find the best solution.
We can always combine the two approaches. Row matching quickly reduces the number of states. The more complicated implication chart method, now working with fewer states, finds the equivalent states missed by row matching more rapidly.
9.2.1 Row-Matching Method
Let's begin our investigation of the row-matching method with a detailed example. We will see how to transform an initial state diagram for a simple sequence detector into a minimized, equivalent state -diagram.Four-Bit Sequence Detector: Specification and Initial State Diagram Let's consider a sequence-detecting finite state machine with the following specification. The machine has a single input X and output Z. The output is asserted after each 4-bit input sequence if it consists of one of the binary strings 0110 or 1010. The machine returns to the reset state after each 4-bit sequence.
We will assume a Mealy implementation. Some sample behavior of the finite state machine is
= 0010 0110 1100 1010 0011 Z
= 0000 0001 0000 0001 0000 The output is asserted only after the previous four serial inputs match one of the specified strings. Also, the input patterns do not overlap: the machine makes a decision to assert its output after each group of 4 bits.
Because this finite state machine recognizes finite length strings, we can place an upper bound on the number of states needed to recognize any particular binary string of length four.
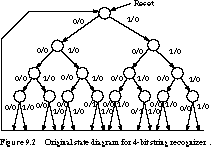
Figure 9.2 shows the state diagram. There are 16 unique paths through the state diagram, one for each possible 4-bit pattern. This adds up to 15 states and 30 transitions. We highlight the paths leading to recognition of the strings 0110 and 1010 in the figure. Only two of the transitions have a 1 output, representing the accepted strings.
Four-Bit Sequence Detector: State Table and Row-Matching Method We can combine many of the states in Figure 9.2 without changing the input/output behavior of the finite state machine. But how do we find these equivalent states in a systematic fashion?
First, we look at the state transition table, as shown in Figure 9.3.
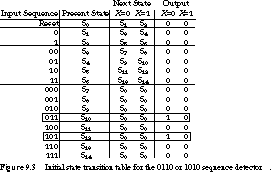
This table is in a slightly different format than we have seen so far. It contains one row per state, with multiple next-state and output columns based on the input combinations. It gives exactly the same information as a table with separate rows for each state and input combination.
The input sequence column is a documentation aid, describing the partial string as seen so far. When read from left to right, it describes the sequence of input bits that lead to the given state.
Next we examine the rows of the state transition table to find any with identical next-state and output values (hence the term "row matching"). For this finite state machine, we can combine S10 and S12. Let's call the new state S10' and use it to rename all transitions to S10 or S12. The revised state table is shown in Figure 9.4.
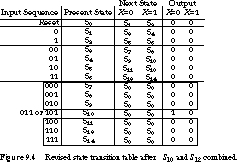
Four-Bit Sequence Detector: Row-Matching Iteration We continue matching rows until we can no longer combine any. In Figure 9.4, S7, S8, S9, S11, S13, and S14 all have the same next states and outputs. We combine them into a renamed state S7'. The table, with renamed transitions, is shown in Figure 9.5.
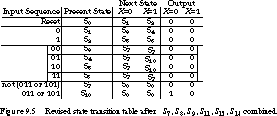
Now states S3 and S6 can be combined, as can S4 and S5. We call the combined states S3' and S4', respectively. The final reduced state transition table is shown in Figure 9.6.

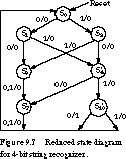
In the process, we have reduced 15 states to just 7 states. This allows us encode the state in 3 bits rather than 4. The reduced state diagram is given in Figure 9.7.
Limitations of the Row-Matching Method Unfortunately, row matching does not always yield the most reduced state table. We can prove this with a simple counterexample.

Figure 9.8 shows the state table for the three-state odd parity checker of Figure 9.1. Although states S0 and S2 have the same output, they do not have the same next state. Thus, they cannot be combined by simple row matching. The problem is the self-loop transitions on input 0. If we combined these two states, the self-loop would be maintained, but this is not found by row matching. We need another, more rigorous method for state reduction.
9.2.2 Implication Chart Method
The implication chart method is a more systematic approach to finding the states that can be combined into a single reduced state. As you might suspect, the method is more complex and is better suited for machine implementation than hand use.Three-Bit Sequence Detector: Specification and Initial State Table We illustrate its use with another example. Your goal is to design a binary sequence detector that will output a 1 whenever the machine has observed the serial sequence 010 or 110 at the inputs. We call this machine a 3-bit sequence detector.

Figure 9.9 shows its initial state table.
Data Structure: The Implication Chart The method operates on a data structure that enumerates all possible combinations of states taken two at a time, called an implication chart.
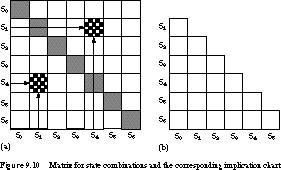
Figure 9.10(a) shows the chart with an entry for every pair of states. This form of the chart is more complicated than it needs to be. For example, the diagonal entries are not needed: it does not reduce states to combine a state with itself! And the upper and lower triangles of entries are symmetric. The chart entry for Si and Sj contains the same information as that for Sj and Si. Thus, we work with the reduced structure of Figure 9.10(b).
We fill in the implication chart as follows. Let Xij be the entry whose row is labeled by state Si and whose column is labeled by state Sj. If we were able to combine states Si and Sj, it would imply that their next-state transitions for each input combination must also be equivalent. The chart entry contains the next-state combinations that must be equivalent for the row and column states to be equivalent. If Si and Sj have different outputs or next-state behavior, an X is placed in the entry. This indicates that the two states can never be equivalent.
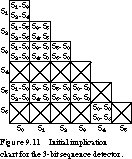
Three-Bit Sequence Detector: Initial Implication Chart The implication chart for the example state table is shown in Figure 9.11. S0, S1, S2, S3, and S5 have the same outputs and are candidates for being combined. Similarly, states S4 and S6 might also be combined. Any combination of states across the two groups, such as S1 and S4, is labeled by an X in the chart. Since their outputs are different, they can never be equivalent.
To fill in the chart entry for (row) S1 and (column) S0, we look at the next-state transitions. S0 goes to S1 on 0 and S2 on 1, while S1 goes to S3 and S4, respectively. We fill the chart in with S1-S3, the transitions on 0, and S2-S4, the transitions on 1. We call these groupings implied state pairs. The entry means that S0 and S1 cannot be equivalent unless S1 is equivalent to S3 and S2 is equivalent to S4. The rest of the entries are filled in similarly.
At this point, the chart already contains enough information to eliminate many impossible equivalent pairs. For example, we already know that S2 and S4 cannot be equivalent: they have different output behavior. Thus there is no way that S0 can be equivalent to S1.
Finding these cases is straightforward. We visit the entries in sequence. For example, start with the top square in the first column and advance from top to bottom and left to right. If square Si,Sj contains the implied state pair Sm-Sn and square Sm,Sn contains an X, then mark Si,Sj with an X as well.
Sequence Detector Example: First Marking Pass Figure 9.12 contains the results of this first marking pass. Entry S2,S0 is marked with an X because the chart entry for the implied state pair S2-S6 is already marked with an X. Entry S3,S0 is also marked, because entry S1,S0 (as well as S2,S0) has just been marked. The same is true for S5,S0. By the end of the pass, the only entries not marked are S2,S1; S5,S3; and S6,S4.
Sequence Detector Example: Second Marking Pass We now make a second pass through the chart to see if we can add any new markings. Entry S2,S1 remains unmarked. Nothing in the chart refutes that S3 and S5 are equivalent. The same is true of S4 and S6.
Continuing, S3,S5 and S4,S6 are now obviously equivalent. They have identical outputs and transfer to the same next state (S0) for all input combinations.
Since no new markings have been added, the algorithm stops.
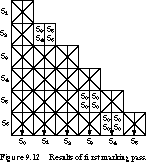
The unmarked entries represent equivalences between the row and column indices: S1 is equivalent to S2, S3 to S5, and S4 to S6. The final reduced state table is shown in Figure 9.13.

Multi-Input Example: State Diagram and Transition Table We can generalize the procedure for finite state machines with more than one input. The only difference is that there are more implied state pairs: one for each input combination.
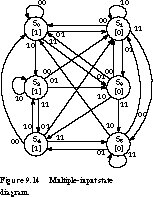
Let's consider the state diagram for a two-input Moore machine shown in Figure 9.14. Each state has four next-state transitions, one for each possible input condition. The derived state transition table is given in Figure 9.15.

Multi-Input Example: Implication Chart Processing Figure 9.16 shows the implication chart derived from the state transition table. Let's see how some of the entries are filled in. Since S1 and S0 have different state outputs, we place X in entry S1,S0. For the S2,S0 entry, we list the implied state pairs under the input conditions 00, 01, 10, 11. Because S0 stays in S0 on input 00, while S2 goes to S1 on 00, we add the implied state pair S0-S1 to the entry. On input 01, S0 goes to S1, S2 goes to S3, and we add S1-S3 to the entry. Similarly, we add the pairs S2-S2 on 10 and S3-S4 on 11 to the entry and fill in the rest of the entries.
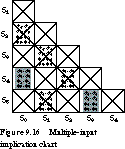
Now we begin the marking pass. Working down the columns, we cross out entry S2-S0 because S0,S1 is already crossed out. The same thing happens to the entries S3,S1; S5,S1; and S4,S2. This leaves S4,S0 and S5,S3 unmarked (these are highlighted in the figure). Their being unmarked implies that S4 is equivalent to S0 (renamed S0') and S3 is equivalent to S5 (S3'). The reduced state table is given in Figure 9.17.

Example State Reduction of Parity Checker Finite State Machine The row-matching method could not combine states S0 and S2 in the three-state parity checker of Figure 9.1. Can the implication chart method do the job?
The implication chart for the state transition table of Figure 9.8 is given in Figure 9.18.

S1,S0 and S2,S1 are marked immediately because their outputs differ. The remaining square is left unmarked, implying that S0 and S2 are equivalent. This is the correct reduced state transition table.
Implication Chart Summary The algorithm for state reduction using the implication chart method consists of the following steps:
- Construct the implication chart, consisting of one square for each possible combination of states taken two at a time.
- For each square labeled by states Si and Sj, if the outputs of the states differ, mark the square with an X; these states are not equivalent. Otherwise, they may be equivalent. Within the square, write implied pairs of next states for all input combinations.
- Systematically advance through the squares of the implication chart. If the square labeled by states Si,Sj contains an implied pair Sm-Sn and square Sm,Sn is marked with an X, then mark Si,Sj with an X. Since Sm and Sn are not equivalent, neither are Si and Sj.
- Continue executing step 3 until no new squares are marked with an X.
- For each remaining unmarked square Si,Sj, you can conclude that states Si and Sj are equivalent.