Adventure of Binary Code
The source code of Linux and other open -source systems is literally read until the listings became well-thumbed. It is difficult to find something principally new here. Windows is a different matter. The impassable jungle of the binary code frightens the newbies, and the vast disassembled listings remain unstudied. An intricate tangle of nested calls hides an enormous number of programming blunders, which let intruders gain the unlimited power of the system. In this section, I will demonstrate how hackers find these blunders.
It is generally considered that the availability of the source code is the foundation, upon which the reliability of any operating system is based, because under open-source conditions it is practically impossible to hide back doors or Trojan components . Thousands experts and enthusiasts from all over the world will analyze the software and eliminate all bugs , both intentional and unintentional. As relates to the compiled binary code, the laboriousness of its analysis is unjustifiably large. No one will spend time and effort without strong motivation. This is a weighty argument of open-source supporters, known for their radicalism and negation of objective reality.
The reality is that analyzing the source code of contemporary applications within a reasonable time is impossible, both physically and economically. Even good old MS-DOS 6.0 in source code is more than 60 MB in size . Even if the source code is considered fictional, just imagine how long it will take you to read it. However, source code isn't light reading, and it isn't a fiction book. It is the conglomerate of intricately communicating data structures, entangled with machine code.
With an average length of one x86 machine command equal to 2 bytes, each kilobyte of compiled code contains about 500 disassembled lines, corresponding to about ten pages of printed text. A 1-MB novel in binary form is impossible to read within a reasonable time. Contemporary software products cannot be investigated down to the last comma. The availability of the source code doesn't considerably change this situation. It doesn't matter how long it will take to complete the job ” a thousand years or even a billion. The procedure of searching for security holes is hard to parallelize and distribute among participants of the project. Individual program sections are not executed independently. On the contrary, they intricately interact with one another, and not all errors are concentrated in the same location ” most of them are "spread" over a large program fragment, and in multithreaded environments they are distributed in time.
Techniques of automated searching for vulnerabilities, which would be worked through for wide "industrial" use, are nonexistent and unlikely to appear. Direct analysis detects only a trace of the most severe and self-evident errors. All other bugs have to be detected only in the course of real-world program usage under production conditions. Nevertheless, statistical investigations have shown that errors never appear without a particular reason. They always have their internal system and internal pattern. Thus, the region of research narrows significantly, and the amount of work that needs to be done using the disassembler becomes real.
Analysis of machine code has its strong and weak points. The good news is that here there are not horrible #define directives, and it is not necessary to distract from the main goal to find out, which code is complied and which isn't. In addition, here there are no macros ( especially multiline ones), and it is always possible to distinguish functions from constants and constants from variables . There are no overlapping operators and no implicit constructor calls (although destructors of global classes still continue to be called implicitly). Briefly, the compiler relieves you of a dozen problems that complicate reading the source code listings. According to programmers' folklore, C/C++ is the "write-only language."
The bad news is that a single line of the source code might correspond to dozens of machine commands. At the same time, optimizing compilers do not translate the program sequentially. On the contrary, they might arbitrarily mix machine commands from neighboring lines of source code, thus turning the disassembled listing into a puzzle. All high-level flow control commands, such as loops and branches, are split into chains of conditional jumps. These conditional jumps correspond to the IF GOTO operator of the early Basic dialects. There are no comments. Data structures are destroyed . Symbolic names are preserved only partially ” for example, in RunTime Type Information (RTTI) classes and some imported or exported functions. Most frequently, the class hierarchy with complex inheritance might be fully recovered; however, the time required for such reconstruction will be unjustifiably long.
Surprisingly, and despite all their differences, techniques of analyzing machine code and techniques of analyzing source code have much in common, which makes them equal in rights. Disassembling is not the enigmatic occupation it seems at first glance. It can be mastered by any average programmer. Still, you should read Hacker Debugging Uncovered by Kris Kaspersky or any other book on this topic; otherwise , this chapter may be too abstract for you.
Step-By-Step Guide for Code Analysis
There are different approaches to the investigation of the binary code. The techniques of blind search do not suggest anything except methodically checking different combinations of input data (as a rule, these might be strings of different lengths used mainly for detecting overflowing buffers). Purposeful analysis requires fundamental knowledge of the system, a nontrivial way of thinking, and experience of designing "industrial" software products. The hacker must exactly know before-hand what must be found in the result of the search, the pet errors of the developers, the most probable locations where bugs are concentrated, and the specific features and limitations of different programming languages. Disassembling skills alone are not enough (I assume that you know how to disassemble).
A brute-force attack doesn't always produce a positive result, and lots of security holes may remain undetected. On the other hand, studying a disassembled listing also is not a guarantee of success. You might spend years but never find a worthy bug. This depends on your luck. Therefore, before starting the disassembling, make sure that everything in your power has been done already. At the least, it is necessary to carefully investigate the input fields by supplying long strings. At the most, it is necessary to try typical conceptual vulnerabilities. In particular, if the firewall being attacked freely passes strongly-fragmented TCP packets, then there is no need to disassemble it. It immediately becomes clear that to detect such a hole in the binary code, it is necessary to clearly understand the working mechanism of the firewall and assume its existence beforehand. Because this is so, it will be much easier to form a fragmented packet on your own and look at how the firewall would react to it. Forged packets are a different matter. When sending them to the target computer, the hacker must know, which fields are checked and which are not. Here it is impossible to do without disassembling. It is necessary to locate the code responsible for header processing and analyze the criteria, according to which the packets are discarded. After all, the disassembler is only an instrument, and it cannot play the role of a generator of ideas. Aimless disassembling is a road that leads nowhere.
To a considerable extent, any program is made up of libraries, and analyzing these doesn't make any sense. All libraries were analyzed in detail long ago, and no radically new holes can be found there. In addition, the overwhelming majority of libraries are distributed with the source code, which makes disassembling them even more senseless. In most cases, the library code is located after the main code of the program, and separating it is an easy job. However, it is much more difficult to identify the name of the library functions; without knowing them, you'll become stuck in the disassembled listings as though they were a bog. Fortunately, the vast majority of standard libraries are automatically recognized by IDA. The signatures of exotic libraries from third-party developers can be manually added at any moment, thanks to IDA, which provides such a possibility (for more details, see Hacker Disassembling Uncovered by Kris Kaspersky and standard documentation supplied as part of the IDA product).
IDA makes the decision about loading a specific signature database on the basis of analysis of the start-up code; thus, "foreign" libraries might remain unrecognized. The same happens when loading memory dumps with damaged or missing start-up code or an incorrectly set entry point (which is the chronic ailment of all dumpers). Therefore, if most of the program functions remain unrecognized (Fig. 8.1), try to manually load the signature database. To achieve this, select the FLIRT Signature file command from the File ’ Load file menu. After that, a long list of all libraries known to IDA will appear (Fig. 8.2). Which one should you choose? If you are a beginner with disassembling and cannot identify the required library manually, you can use the trial method, loading one signature after another and trying to achieve maximum extension of the blue filling (Fig. 8.3).
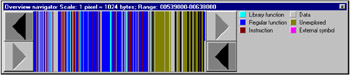
Figure 8.1: The IDA Pro navigator. The domination of blue means that most library functions remain unrecognized, because the disassembler could not determine the type of compiler. In this case, appropriate signatures must be loaded manually
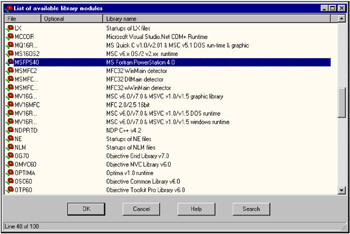
Figure 8.2: The list of signatures known to IDA
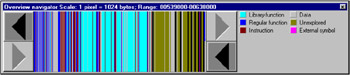
Figure 8.3: The domination of blue filling means that now everything is OK
When viewing the list of recognized and imported functions, it is necessary to choose the most dangerous ones. First, these are functions that accept the pointer to the allocated buffer and return data of an unpredictable size (such as sprintf or gets ). The functions with an explicit limitation on the maximum allowed buffer length ( fgets, GetwindowText, GetFullPathName ) are considerably less dangerous, although even for such functions no one can provide any guarantee that they would behave legally. The complete list of potentially dangerous functions is too long. Therefore, it won't be provided here. However, a brief listing of the most dangerous functions is provided in Table 8.1.
| Function | Overflow probability |
|---|---|
| gets | Extreme |
| strcpy /strcat | Extreme |
| memmove / memcpy | High |
| sprintf/vsprintf/fsprintf | High |
| scanf/ sscanf /fscanf/ vscanf /vsscanf | High |
| wcscpy/wcscat/wcsncat | High |
| wmemset/wcsncpy | High |
| wmemmove/wmemcpy | High |
| strncpy /vsnprint/ snprintf / strncat | High |
The programmers often allocate buffers of a considerably smaller size and this precaution doesn't work. Consider the example shown in Listing 8.2. If the user enters a string 100 or more bytes long, then buffer overflow is inevitable and no length limitations would help.
| |
#define MAX_BUF_SIZE 100 #define MAX_STR_SIZE 1024 char *x; x = malloc(MAX_BUF_SIZE); fgets(x, MAX_STR_SIZE, f) ;
| |
As was already mentioned, a complete list of potentially dangerous functions will not be provided here. It is much better to learn how to act according to specific circumstances. Load the program being studied into a disassembler (the preferred one is IDA Pro), press <Shift>+<F3>, and click the L column with the mouse ("L" stands for library), thus separating library functions from all other ones. (This function is missing in the console version of the application.) Then take a weighty volume of the user manual or start MSDN and view the prototypes for all functions listed here (something like char*, void*, LPTSTR , etc.). If this buffer accepts the data returned by the function, then it is worth trying to check how it would react to overflow.
Press <Enter> to go to the beginning of the function, then choose the following menu options: View ’ Open Subview ’ Cross Reference . The window containing cross-references will open. Each cross-reference leads to the point, at which the function being investigated was called. Depending on the specific features of the compiler and the programming style of the developer of the investigated application, the call might be direct (like call our_func ), or indirect (something like mov ecx, pclass/mov ebx, [ecx + 4]/call ebx/.../pclass dd xxx/dd offset our_func ). In the latter case, cross-references to our_func will lead to dd offset our_func , and in this case it will be difficult to locate the point, at which it was actually called. As a rule, hackers in such cases start the debugger and set a breakpoint to our_func , after which they write the EIP of all locations, from which it is called (by the way, this process becomes considerably faster in the latest IDA versions because of the availability of the integrated debugger).
Finally, the hacker comes close to the environment of the calling code. If the argument determining the size of the buffer being accepted is a direct value (something like push 400h , as in Listing 8.3), this is a good sign, indicating that the hole, most probably, is somewhere near. If this is not the case, do not fall into despair. Instead, scroll the cursor slightly upward and view where this size is initialized . It probably represents a constant passed via a long chain of variables or even arguments of the parent functions.
| |
.text:00401017 PUSH 400h .text:0040101C MOV ECX, [EBP + var_8] .text:0040101F PUSH ECX .text:00401020 CALL _fgets
| |
The course of actions is shown in Fig. 8.4. Take a library function, the prototype of which allows potential overflow capability (step 1). Then, using cross-references, go to the environment near the point of its call (step 2). View the limitation of the maximum allowed length of the return data and compare it with the size of the allocated buffer (step 3). Based on the result of this comparison, it is possible to draw a conclusion about the possibility (or impossibility ) of the overflow.
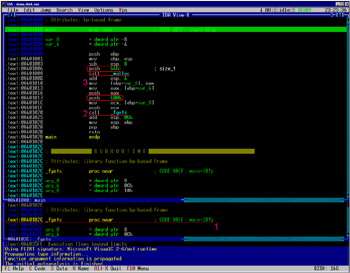
Figure 8.4: Drawing a conclusion about the possibility (or impossibility) of overflow
Now find the code that allocates memory for the buffer. As a rule, this task is carried out by the malloc and new functions. If the argument determining the size of memory to be allocated also is a constant and this constant is smaller than the maximum allowed length of the return data, then the hole is detected. After that, the hacker can proceed with analysis of the possible methods of influencing the overflowing buffer using the input data fields.
The rules of designing safe code state that before allocating a buffer, it is necessary to determine the exact size of data that must be placed there. In other words, in a correctly-written program the call to malloc or new must always be preceded by strlen, GetwindowTextLength , or something similar. Otherwise, the program will have a potential vulnerability. The presence of a preventive check of the size alone doesn't guarantee program stability. This is because the requested size is not always determined correctly, especially if data from several sources are loaded into the buffer.
Dealing with local variables is more complicated in this respect, because their size has to be explicitly specified at compile time, when the length of return data is not yet known. No wonder that overflowing buffers are most frequently encountered among local variables.
Local variables are stored in stack frames , also known as automatic memory. Each function is allocated its own personal frame, into which all local variables belonging to that function are loaded. Most frequently, the frame is formed by the sub esp, xxx machine commands; more rarely, it is formed by the add esp, -xxx command, where xxx is the frame size in bytes. Current versions of IDA Pro by default interpret all direct values and unsigned numbers . Therefore, the conversion of xxx into -xxx must be carried out manually by pressing the <-> key.
Unfortunately, in general it is impossible to divide a monolithic frame into individual local variables. This is because the compiler destroys the initial information, thus making analysis ambiguous. However, for the goals here, the capabilities of the automatic analyzer built into IDA Pro are more than enough. Assume that local buffers most frequently have the byte * type and their size is at least 5 bytes (although, as statistics have shown, most frequently overflow errors are encountered in 4-byte buffers, which in the course of superficial analysis can be easily confused with DWORD ).
As an example, consider the stack frame in Listing 8.4, parsed by the automatic IDA Pro analyzer, and try to detect local buffers there.
| |
.text:00401012 sub_401012 proc near ; CODE XREF: start + AFp .text:00401012 .text:00401012 var_38 = dword ptr -38h .text:00401012 var_34 = byte ptr -34h .text:00401012 var_24 = byte ptr -24h .text:00401012 var_20 = byte ptr -20h .text:00401012 var_10 = dword ptr -l0h .text:00401012 var_C = dword ptr -0Ch .text:00401012 var_8 = dword ptr -8 .text:00401012 var_4 = dword ptr -4 .text:00401012
| |
The var_38 variable has the DWORD type and occupies 4 bytes (the size of the variable can be determined by subtracting the address of the current variable from the address of the next variable: (-34h) - (-38h) = 4h . It doesn't look like a buffer.
The var_34 variable has the BYTE type and occupies l0h bytes, which is typical for local buffers. The same is true for the var_20 variable. The var_24 variable, although it has the BYTE type, takes only 4 bytes. Therefore, it might represent either a compact local buffer or a simple scalar variable (note that the latter is encountered much more frequently). Until all explicit buffers are investigated for the possibility of overflow, it doesn't make sense to consider such "candidates for the buffer role."
Viewing the disassembled function code, find all references to the detected buffer and analyze the possibilities of its overflow. Consider, for example, Listing 8.5.
| |
text:0040100B PUSH 300 text:0040100D LEA EAX, [ EBP + var_34 ] text:00401010 PUSH EAX text=00401011 CALL _fgets text:00401016 ADD ESP, 0Ch
| |
It becomes immediately clear that the var_34 variable is used for storing the input string (which means that this is a buffer) with the maximum allowed length of 300h bytes. At the same time, the local variable has a length of l0h bytes. It is ev e n possible that var_34, var_24 , and var_20 are " parts " of a single buffer; however, this wouldn't change anything because their total size is considerably smaller than 300h .
If, despite all efforts, overflowing buffers could not be found among local variables, it is possible to try searching among the ruins of the dynamic memory, tracing all cross-references to functions such as new and malloc , and analyzing the vicinities of the points of their calls.
Nevertheless, do not rejoice prematurely after locating an overflowing buffer in one of deeply-nested functions. It is possible that the detected buffer is not related to the flow of input user data or (even more disappointingly) that one of the parent functions limits the maximum allowed input length, in which case no overflow will occur. Users of the graphical version of IDA can use the CALL GRAPH instrument for viewing the calls tree that displays the interrelations between child and parent functions and allows you (at least, in theory) to trace the route of the data supplied by the user along the entire program (Fig. 8.5). Unfortunately, the lack of any navigation capabilities (even the simplest searching capabilities are missing) depreciates all potential benefits of CALL GRAPH . It is simply unrealistic to navigate in the diagrams that it builds. However, who can prevent hackers from developing adequate visualization tools on their own?
Until adequate GUI tools appear, hackers have to use the debugger. To begin with, fill all available fields of the user input, set a breakpoint to the call to the function that reads them (the recv function, for example), set breakpoints directly to the buffer that receives the input data, and wait for subsequent attempts to access them. Most frequently, the data are not processed immediately after reception . On the contrary, they travel through the chain of intermediate buffers, each of which might be vulnerable to overflow errors. To keep the situation under control, it is necessary to set breakpoints at every intermediate buffer and trace their release (after release of the local buffer, the memory area belonging to it can be used by anyone else, causing false popups of the debugger, which makes the hacker nervous and produces no results except a waste of the time). But there are only four breakpoints. How is it possible to trace access to dozens of local buffers using only four breakpoints?
Here is the way out. The Softlce version for Windows 9 x supports setting breakpoints to entire regions , and the number of such breakpoints is practically unlimited. Unfortunately, the Softlce version for Windows NT lacks this feature, and hackers must emulate it using intricate manipulations over the page attributes. By switching the page to the NO_ACCESS state, it is possible to trace all attempts at accessing it (including the buffer being studied). If the buffer size is significantly smaller than the page size (which is 4 KB), then each time the debugger pops up it will be necessary to find out, which variable was accessed. If desired, this process can be fully or partially automated, because there are lots of features for Softlce supporting scripting languages.
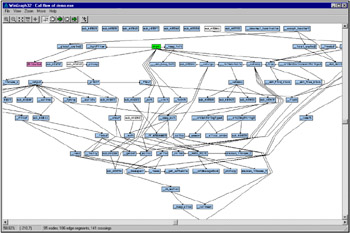
Figure 8.5: Hierarchy of function calls in graphical representation
This is the way, in which it is necessary to search for holes. Maximum routine work, minimum creativity. Nevertheless, it is much cooler to work with the debugger than watch The Matrix again or upgrade your computer to play Doom 3.
Important Tips
Here are some tips and practical recommendations for those who are going to look for vulnerabilities to overflow:
-
When searching for overflowing buffers by the method of blind brute-force testing, test different string lengths, not only the strings whose lengths go beyond all possible limits. Parent functions might limit the input string lengths from above, thus forming a narrow gap, when shorter strings are not causing overflow, and longer strings are truncated when approaching the overflowing buffer.
-
When viewing the HEX dump, pay special attention to undocumented keys (most frequently they are written as plaintext). Some of them allow a hacker to bypass the security system and carry out unpredictable actions over the program.
-
If the program being investigated is written using the Virtual Computer Library (VCL), process it with the DEDE utility, which would supply lots of interesting information.
-
Investigate only the part of the code that is actually called by the program being investigated. To determine, which part of the code is called, use the Code Coverage product from NuMega.
-
Before searching for holes in the program being investigated, make sure that they have not been discovered by someone else. Collect all holes already discovered and mark them on the map of the disassembled code.
-
Remember that optimizing compilers inline the memcpy/strcpy and memcmp /strcmp functions by directly inserting their bodies into the code. Therefore, look for the rep movs/rep cmps instructions and investigate in their vicinity.
-
If the program being investigated skillfully withstands a Softlce attack, start it under the emulator with the integrated debugger.
-
Do not rely completely on the automatic analyzer! IDA Pro frequently errs by incorrectly interpreting (or even failing to recognize) some library functions, skipping cross-references, and confusing code and data.
-
Hackers are not the only ones who search for holes. Software developers do the same thing. Compare the disassembled listings of newer versions with those of earlier releases, and analyze all changes detected. Some of these changes probably eliminate holes that are not widely known to the user community.
EAN: 2147483647
Pages: 164