Network Monitor
The Microsoft utility Network Monitor 2.0 included with SMS 2.0 is yet another SMS administrator tool that enables you to analyze and monitor network traffic among computers in your network. Network Monitor is similar in function to other, more expensive hardware-based tools currently on the market. It is used to identify heavily used subnets, routers, and WAN connections; to recognize bottlenecks and potential bottlenecks; and to develop trends to optimize the network infrastructure and placement of computers, servers, and in our particular case, SMS site systems.
There are actually two parts to this tool: the Network Monitor interface itself and the Network Monitor Agent. Unlike SMS 1.2, with SMS 2.0 the Network Monitor Agent no longer needs to be installed as a service on the computer to be monitored. Instead, it is initiated at the time the remote connection is made to begin capturing data.
![]()
NOTE
Network Monitor 2.0 should not be confused with the version that can be installed on any Windows NT 4.0 server. The version that comes with Windows NT 4.0 servers is a feature-limited copy of the earlier version of Network Monitor and allows monitoring of traffic only for traffic originating from or received by the server in question.
Network Monitor 2.0 provides the following functions:
- Captures, filters, and displays network frames
- Edits captured frames and forwards them
- Monitors traffic for remote computers
- Determines which users and protocols used the most bandwidth
- Determines the location of routers
- Resolves device names to MAC addresses
Network Monitor 2.0 also includes experts. These are not little network gurus that come popping out of the box—experts are post-capture analysis tools that can facilitate the administrator's understanding of the data collected. Table 6-4 lists these experts and describes what they are designed to accomplish.
Table 6-4. Network Monitor 2.0 experts
| Expert | Description |
|---|---|
| Average Server Response | Time Identifies the average time each server in the capture took to respond to requests |
| Property Distribution | Calculates protocol statistics for a specified protocol property in a capture |
| Protocol Coalesce Tool | Combines all the frames of a single transaction that may have been fragmented into a single frame and creates a new capture file using this information |
| Protocol Distribution | Calculates which protocols generated the most traffic during the capture session |
| TCP Retransmit | Identifies which TCP frames were transmitted more than once during the capture, indicating congestion or connectivity issues |
| Top Users | Identifies the senders and recipients of frames that generated the most traffic during the capture session |
In addition to the Network Monitor utility and its features and experts, the SMS Administrator Console offers monitors—analysis tools that can be used prior to capturing frames to monitor for specific types of network activity. (The next section covers capturing frames in more detail.) Once the monitors have been configured, they generate events based on criteria supplied by the SMS administrator. Table 6-5 describes the available default monitors that are installed if you chose Network Monitor as an Install option during setup.
Table 6-5. Network Monitor 2.0 monitors
| Monitor | Description |
|---|---|
| ICMP Redirect Monitor | Generates an event each time an unauthorized or improperly configured router redirects Internet Control Message Protocol (ICMP) frames. |
| IP Range Monitor | Generates an event when a frame has an IP address outside the specified valid range. |
| IP Router Monitor | Generates an event when a specified IP router fails. |
| IPX Router Monitor | Generates an event when a specified IPX router fails. |
| Rogue Monitor | Generates an event when invalid, unauthorized DHCP or WINS servers are found on the network. |
| Security Monitor | Generates an event when unauthorized users are detected using Network Monitor to capture frames on the network. Security Monitor prevents these users from capturing data. |
| SynAttack Monitor | Half-open, unresponsive, or other suspicious connections are made to identified servers on the network. |
Using Network Monitor 2.0
To run Network Monitor 2.0, you and your computer must meet the following requirements:
- Your computer must be running Windows NT 4.0 with Service Pack 3 or later and Microsoft Windows Internet Explorer 4.01 or later.
- You must have local Administrator privileges on the computer running Network Monitor 2.0 and/or local Administrator privileges on the remote computer that will be monitored using the Network Monitor Agent.
- Your computer must have a network interface card (NIC) that supports Promiscuous mode (meaning that it is able and ready to receive any and all frames).
- Windows Management must be installed and running.
- You must have already installed Network Monitor 2.0 (by running Setup from the SMS 2.0 CD).
Network Monitor 2.0 has its own online help, which can assist you with the more detailed uses of the product. For now, let's look at some of the more common uses and features and some fundamentals for using Network Monitor 2.0.

PLANNING
SMS 2.0 Service Pack 1 includes upgrades to Network Monitor 2.0. If you install Network Monitor using the Setup.exe file found in the Nmext folder of the service pack source files, the Setup program will uninstall any previous Network Monitor 2.0 external installation. (An external installation is one performed outside the SMS Setup program. See Chapter 2 for a discussion of the SMS Setup program.) Previous versions of Network Monitor are not automatically upgraded to Network Monitor 2.0. To upgrade a previous version, specify that the installation directory for Network Monitor 2.0 be the same as the previous version. Refer to the Microsoft Systems Management Server Version 2.0 Service Pack 1 Release Notes for more information about these issues, as well as other issues regarding the use of Network Monitor 2.0 with various network cards and drivers.
Capturing Data
Network Monitor's primary function is to capture network traffic for analysis and troubleshooting. To use Network Monitor to capture data, follow these steps:
- Start Network Monitor using one of the following techniques:
- From the Systems Management Server program group, select Network Monitor.
- In the SMS Administrator Console, open the Tools folder, right-click on Network Monitor, choose All Tasks from the context menu, and then choose Start Network Monitor.
- The Network Monitor Capture window is displayed, as shown in Figure 6-21. Each section of the Network Monitor Capture window will reflect various aspects of the captured data, but the window is dataless until a capture session is initiated. We'll examine this window in more detail in the section "Viewing Captured Data" later in this chapter. For now, choose Start from the Capture menu to display the captured frames.
- When you have captured enough data, choose Stop from the Capture menu to end the capture session. You can then view the captured frames by choosing Display Captured Data from the Capture menu, or save the captured data as a file for viewing individual frames later.
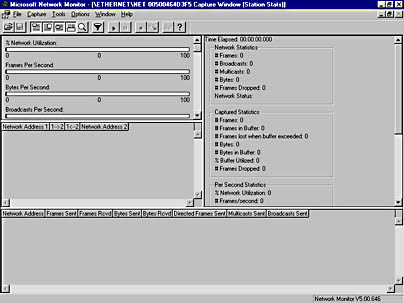
Figure 6-21. The dataless Network Monitor Capture window.
Alternatively, you can choose Stop And View from the Capture menu to end the capture session and immediately view the individual frames that were captured.
Without any further filtering, all frames generated on the network and received by the monitored computer will be captured and potentially saved and displayed. The captured frames can add up quickly, as any network administrator can attest. Frequently, you will be interested in viewing the traffic generated between two specific computers—for example, between the site server and the SQL server hosting the SMS database, between the site server and its site systems, or between an SMS client and a CAP. This task can be easily accomplished by adding a filter before initiating a capture session. Filters can be based on protocols used, a specific frame property such as SAP or Etype, or the originating or destination address. You can also filter based on network segment if you are capturing data remotely.
To establish a capture filter, follow these steps:
- Start the Network Monitor.
- Choose Filter from the Capture menu to display the Capture Filter window, as shown in Figure 6-22.
- Select the property you want to filter against.
- Choose OK in the Capture Filter window to start your capture session. Only frames that meet your criteria will be collected during the capture session.
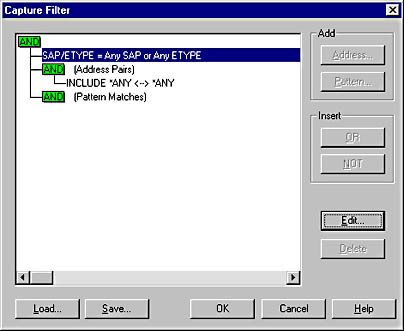
Figure 6-22. The Capture Filter window.
If you choose SAP/ETYPE, you can then click Edit to display the Capture Filter SAPs And ETYPEs dialog box, shown in Figure 6-23, where you can specify the protocols that will be captured during the capture session. By default, all protocols are enabled.
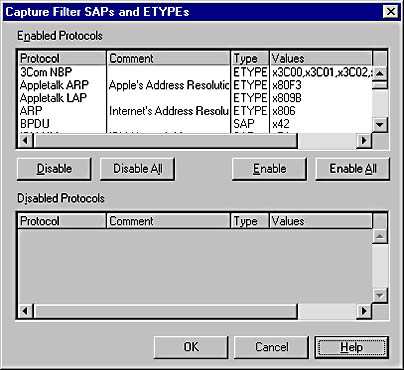
Figure 6-23. The Capture Filter SAPs And ETYPEs dialog box.
If you select INCLUDE under Address Pairs, you can click Edit or Address to display the Address Expression dialog box, shown in Figure 6-24, where you can modify the computers monitored from the default setting of ANY to a specific set of addresses.
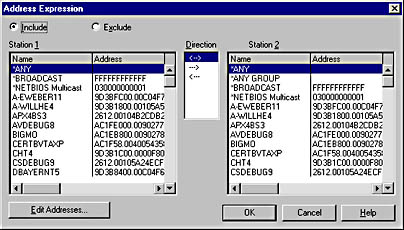
Figure 6-24. The Address Expression dialog box.
If you choose Pattern Matches, you can click Pattern to display the Pattern Match dialog box, shown in Figure 6-25, where you can specify that only frames containing a particular pattern of ASCII or hexadecimal data be captured. This pattern can start at the beginning of the frame or at a specified offset.
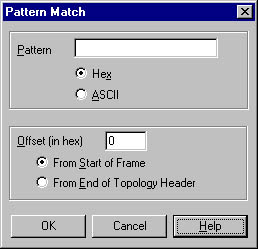
Figure 6-25. The Pattern Match dialog box.
Establishing Capture Triggers
You can also configure Network Monitor to perform an action when the capture file fills to a certain level or when a particular pattern match is detected. This trigger action can sound an audible signal, stop capturing data at that point, or execute a command-line program or batch file.
To establish a capture trigger, follow these steps:
- Start Network Monitor.
- Choose Trigger from the Capture menu to display the Capture Trigger dialog box, shown in Figure 6-26. By default, no triggers are enabled.
- Select the type of trigger you want to enable. "Buffer" refers to the filled size of the capture file, and "pattern match" refers to those frames that contain a particular pattern of ASCII or hexadecimal data The pattern can start at the beginning of the frame or at a specified offset.
- Select a trigger action. These options are fairly self-explanatory. An example of a command-line action might be a NET SEND command to the SMS administrator noting that a capture trigger event occurred—for instance, net send SMSAdmin1 Capture Trigger Event Occurred.
- Click OK to close the dialog box.
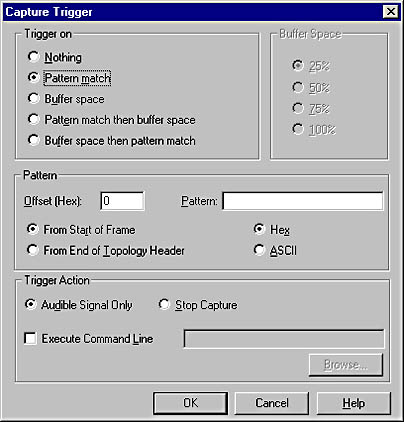
Figure 6-26. The Capture Trigger dialog box.
If you choose a buffer trigger, specify the desired percent of buffer space.
If you choose a pattern match trigger, enter the hexadecimal or ASCII text pattern that you want to match, and an offset value if necessary.
Viewing Captured Data
When you stop a capture session, you can view capture statistics in the Network Monitor Capture window, as shown in Figure 6-27. This window is divided into four sections, or panes. The top left pane, referred to as the Graph pane, contains five graphical charts of the frames generated and received during the capture session. This pane is dynamic and only active during the capture session itself. The data monitored is self-explanatory.
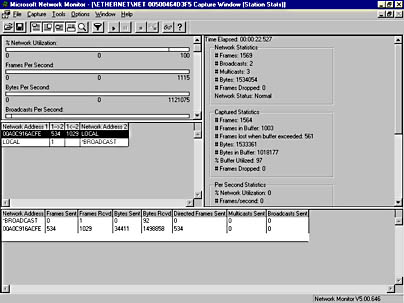
Figure 6-27. The Network Monitor Capture window, showing captured data.
The middle left pane, called the Session Statistics pane, displays a summary of the frames sent and received between this computer and any other specified computers. In this example, 534 frames were sent from a computer with MAC address 00A0C916ACFE to the local server, and 1029 frames were sent from the local server to the other computer.
The bottom pane, called the Station Statistics pane, displays more detailed frame information on a per-computer basis—specifically, the number of frames sent and received, bytes sent and received, directed frames sent, multicast frames sent, and broadcast frames sent.
The right pane, referred to as the Total Statistics pane, displays summary information about the capture session as a whole. This summary information is divided into Network Statistics, Captured Statistics, Per Second Statistics, Network Card Statistics, and Network Card Error Statistics sections.
You probably noticed in Figure 6-27 that Network Monitor identifies source and target computers primarily by their MAC address, which is the network card address, of course. You can make this window as well as the Frames view easier to read by helping Network Monitor to resolve the MAC address to a NetBIOS name. To do so, follow these steps:
- Choose Addresses from the Capture menu to display the Address Database window, shown in Figure 6-28.
- Click Add to display the Address Information dialog box, shown in Figure 6-29.
- Enter the NetBIOS name, or whatever name you want, in the Name text box. Enter the MAC address in the Address text box, and select a network type from the Type drop-down list if necessary.
- Click OK to return to the Address Database window.
- Click Close to close the Address Database window and use the name values for this session, or click Save to save the name values to facilitate viewing of future captures.
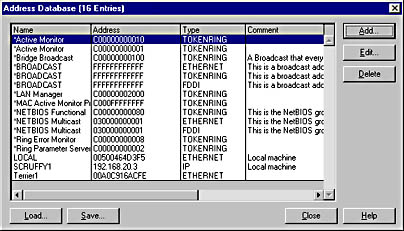
Figure 6-28. The Address Database window.
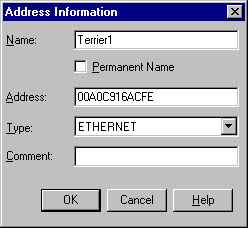
Figure 6-29. The Address Information dialog box.

CAUTION
The maximum size for a capture file is 1024 MB. As you generate capture files that approach this size, Windows may experience low levels of virtual memory or may even run out . As virtual memory runs low, Network Monitor will continue to capture data, although some frames may be dropped due to a corresponding reduction in system performance. If you must generate and view large capture files, be sure to increase the size of the virtual memory page file. Refer to your Windows documentation for instructions on how to modify the page file size. In addition, save the capture file before viewing it, restart Network Monitor, and then open the file.
This statistical information can certainly help identify the amount of traffic generated, but there are still the frames themselves to view. By viewing the frames that were captured, you can understand the type of traffic that was generated and which frames are associated with certain kinds of activity on various servers. For example, you can determine when the CAP forwarded discovery data to the site server and how much traffic was generated as a result.
Frames can be viewed by opening a saved capture file or by choosing Stop And View from the Capture menu when ending a capture session. Figure 6-30 shows a sample capture file of individual frames. In this view, you can see the frames generated and received between the two servers SCRUFFY1 (the local server) and Terrier1.
This screen begins with a frame number, a time offset, the source and destination MAC addresses (which can be resolved to readable names as they have been here), the protocol type of the frame, a brief description of the frame, and the MAC address resolved to a NetBIOS name or IP address.
Each frame is "viewable" in that if you double-click on a frame, you can view the contents of the frame in the Frame Details window, as shown in Figure 6-31.
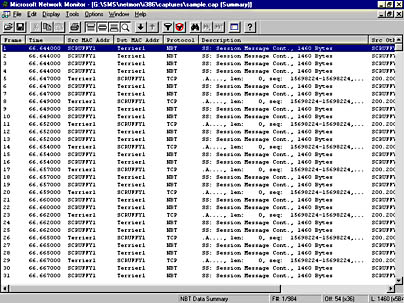
Figure 6-30. A sample capture file showing individual frames that were captured between two computers on a network.
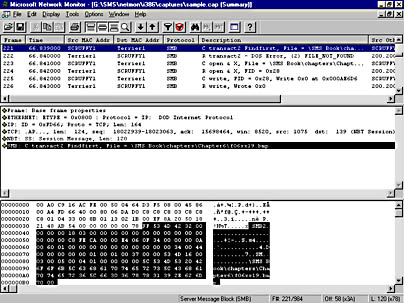
Figure 6-31. The Frame Details window.
At the top is the Summary pane, a tiled view of the capture file we started from. The middle pane is the Detail pane, which provides an expandable view of the contents of the frame currently selected in the Summary pane, including the frame's size, Ethernet information such as MAC address, IP information such as IP address, and Server Message Block (SMB) information such as the frame offset and flags if the frame is part of a fragmented group of frames and the frame data. You can double-click the plus sign (+) or minus sign (-) to expand or collapse the levels of detail that appear in this pane. The bottom pane is the Hex pane, which displays the frame contents in both hexadecimal and text where possible. In this example, the frame is part of a file copy routine that is copying a file named F06xx19.bmp from SCRUFFY1 to Terrier1. The filename can be seen in both the Detail and Hex panes.
![]()
MORE INFO
We won't spend a lot of time here exploring every nuance of using Network Monitor or interpreting frames, especially because there are two Microsoft certified classes that cover the use of Network Monitor in significant detail—MOC 689, "Supporting Microsoft Windows NT Server 4 Enterprise Technologies," and MOC 828, "Planning, Implementing, and Supporting Systems Management Server 2.0." However, we will cover the traffic generated by specific SMS components and agents as well as specific frames to look for as appropriate throughout this book.
Using Experts
We do want to take the time to examine how to use the new experts that come with Network Monitor 2.0 (see Table 6-4), as they are appropriate to our discussion of SMS 2.0. As mentioned, these experts are post-capture analysis tools designed to help facilitate your understanding of the data you collect.
To enable the experts, follow these steps:
- Open a capture file.
- Choose Experts from the Tools menu in the Frame Details window to display the Network Monitor Experts dialog box, shown in Figure 6-32.
- Select the expert you want to enable—in this case, Average Server Response Time—and click Configure Expert to display the Average Server Response Time Configuration dialog box, shown in Figure 6-33. With this expert, you can add and delete TCP/IP port numbers and IPX socket numbers. Other experts will offer other configuration options.
- Click OK to return to the Network Monitor Experts dialog box, and then click Add To Run List.
- When you are ready to run the expert, click Run Experts.
- When the expert has completed processing, a Network Monitor Event Viewer window will be displayed similar to the one shown in Figure 6-34, containing the information you requested. In this example, all experts were selected to run. You can access the result of each expert by clicking on its respective tab in the Event Viewer window.
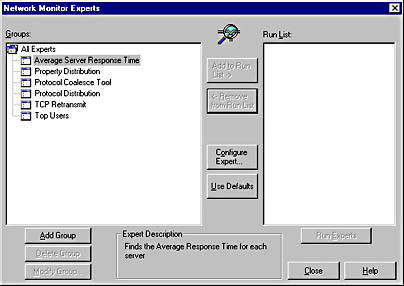
Figure 6-32. The Network Monitor Experts dialog box.
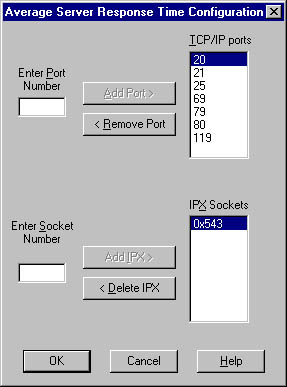
Figure 6-33. The Average Server Response Time Configuration dialog box.
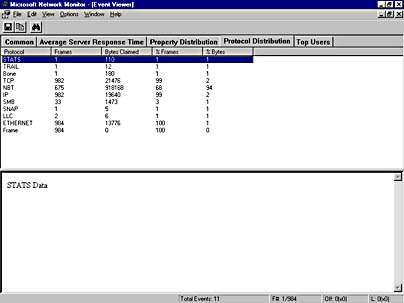
Figure 6-34. The Network Monitor Event Viewer window.
![]()
NOTE
If your capture file consists of a large number of SMB frames, the Average Server Response Time expert may return incorrect averages because it fails to discard duplicate requests. In general, the larger the capture file, the less accurate the averages will be.
Using the Control Tool
As mentioned, this new version of Network Monitor also includes control tools, or monitors, that are properly used as precapture analysis tools. The seven monitors described in Table 6-5 are installed by default; you can also add third-party monitors or create your own custom monitors.
When you configure a monitor, it examines network traffic on the local network segment in real time, watching for specified conditions or frame properties. When a match is found, the monitor generates an event that the SMS administrator can view using the Monitor Control Tool. As with other SMS Administrator Console tools, the Monitor Control Tool uses Windows Management to collect and expose the required information to be viewed through the interface.
To configure and enable monitors, follow these steps:
- In the SMS Administrator Console, navigate to and expand the Tools folder, right-click on Network Monitor, choose All Tasks from the context menu, and then choose Start Network Monitor Control Tool to display the Monitor Control Tool window, shown in Figure 6-35.
- If you want to monitor a remote computer, choose Remote Computer from the File menu to open the Remote Computer dialog box, supply the NetBIOS name or IP address of the computer in question, and then click OK.
- Select the monitor you want to enable from the Installed Monitors list and click Enable. A message box will appear, informing you that the monitor has not yet been configured. Choose Yes to configure the monitor. If you choose No, you can configure the monitor later by selecting it in the Enabled Monitors list and clicking Configure.
- Each monitor will have a different, easy-to-understand configuration screen. You can also press F1 from any configuration screen to access help. Here are three examples:
- Figure 6-36 shows the IP Range Monitor Configuration screen. Recall that this monitor generates an event when an IP address outside a valid identified range generates traffic on the network. Configure this monitor by supplying a range of valid addresses or invalid addresses, depending on whether you want to find any invalid frames or those from a specific address range.
- Figure 6-37 shows the IP Router Monitor Configuration screen. This monitor generates an event when a specified IP router fails (that is, the router is quiet for a specified period of time). Enter the IP addresses of the routers you want to monitor and the amount of time in seconds (10 to 600) that a router must be quiet to be considered nonfunctioning.
- Figure 6-38 shows the Security Monitor Configuration screen. This monitor enables you to specify which computers can run Network Monitor on the local subnet and to disallow any other computers from being able to run it. Enter the MAC addresses of the computers that should run Network Monitor, and specify whether to log IP addresses for those computers, whether to shut down the capture session on invalid computers, and the number of minutes allowed between event notifications that are reported to the Event Viewer window.
- When you have finished setting monitor options, click the Set Monitor Configuration button, located at the bottom of each configuration screen, to return to the Monitor Control Tool window.
- When you have configured your monitors, select each one in the Enabled Monitors list, and click Start to start the monitor.
Alternatively, you can start the Network Monitor Control Tool from the Systems Management Server program group.
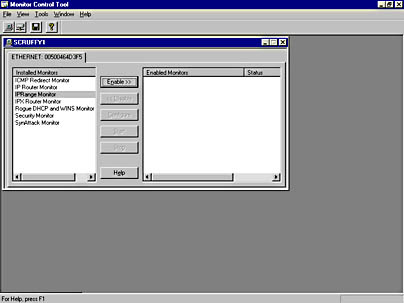
Figure 6-35. The Monitor Control Tool window.
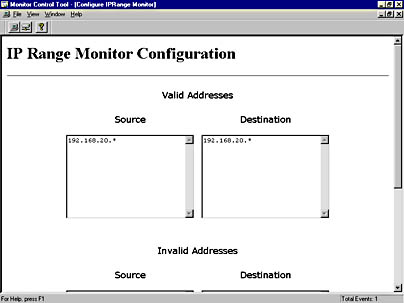
Figure 6-36. The IP Range Monitor Configuration screen.
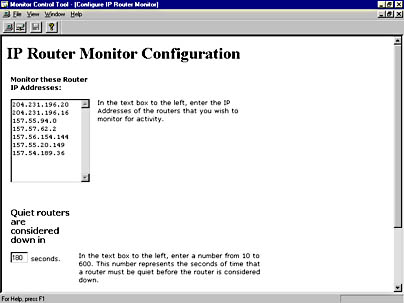
Figure 6-37. The IP Router Monitor Configuration screen.
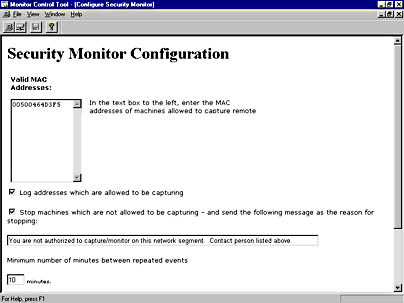
Figure 6-38. The Security Monitor Configuration screen.
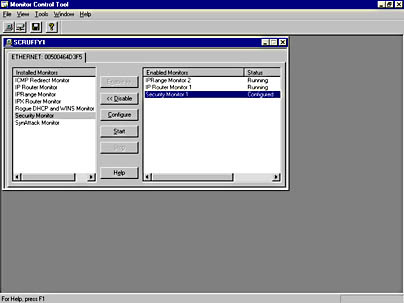
Figure 6-39. The Monitor Control Tool window, showing enabled monitors.
As an event is generated by the monitor, the Event Viewer window appears. Alternatively, you can view the event by choosing Events from the View menu in the Monitor Control Tool window. Figure 6-40 shows an example of events generated by the Monitor Control Tool monitors enabled using the procedure described above.
CAUTION
Security Monitor monitors only the local network segment. If your routers do not forward multicast frames, Security Monitor will not be able to watch other segments. To ensure that Security Monitor can watch other segments, install Network Monitor (and WMI) on a computer in each affected segment and enable Security Monitor on each.
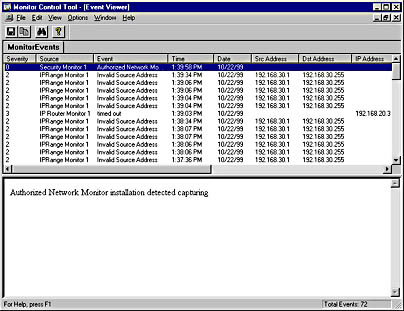
Figure 6-40. The Event Viewer window, listing all events generated by the configured monitors in the order in which the frames were received.
EAN: 2147483647
Pages: 167