Understanding Status Summarizers
Status messages can be configured in a variety of ways. For the most part, the default configuration of the status message system will serve the average site quite well and will generate a sufficient number of messages to facilitate reporting and troubleshooting. However, you might need to modify or enhance the reporting of status messages. One way to control the way messages are displayed in the SMS Administrator Console is by using status summarizers.
Status summarizers provide a mechanism to consolidate the copious amounts of data generated by status messages into a succinct view of the status of a component, a server, a package, or an advertisement. In the Component Status window (shown in Figure 5-2), for example, you are presented with a single entry for each component that indicates the component's status (OK, Warning, or Critical), its state (Started or Stopped), and the number of error, warning, and informational status messages that have been generated. Remember that behind each of these entry summaries can be a host of detailed information about the selected messages. Let's explore some techniques for modifying how the status summarizers consolidate and display the data you see in the SMS Administrator Console.
Display Interval
The status messages that are displayed are filtered first by a display interval. By default, only status messages generated since the most recent midnight are displayed. This limitation does not mean that all previous status messages have been deleted. On the contrary, all status messages are written to the SMS database by default. (You'll learn more about the status message reporting process in the section "Status Message Process Flow" later in this chapter.) The display interval merely facilitates your view of recent messages. You can modify the display interval for status summaries displayed in the Component Status folder and the Advertisement Status folder. Since summaries displayed in the Site System Status folder and the Package Status folder are based solely on state, you cannot modify the display interval for these status messages.
To modify the display interval, right-click on the Component Status folder or the Advertisement Status folder and choose Display Interval from the context menu to display a list of interval options, as shown in Figure 5-16.
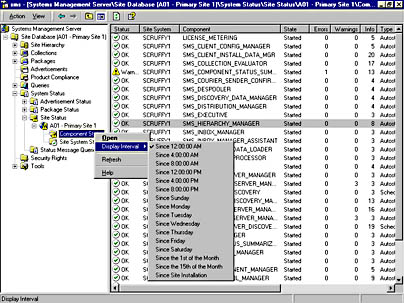
Figure 5-16. Displaying the list of display interval options.
Select the interval option that best suits your viewing needs. Be aware that choosing an interval such as Since Site Installation is likely to net you a significant number of messages to scroll through when you choose Show All Messages from the context menu.
Strictly speaking, the display interval is not so much an attribute of the status summarizer mechanism as it is a way to facilitate your view of the status messages kept in the database. Package status can also be viewed based on display interval; we will discuss package and advertisement status in detail in Chapter 12.
Status Message Thresholds
A status message threshold is a limit that defines when the status summary for a component or site system should indicate OK, Warning, or Critical. This threshold is set by determining the number of actual informational, warning, and error messages that have been generated for each component or site system. When a predetermined number of messages has been collected, the status changes from OK to Warning or from Warning to Critical.
For example, consider the Status Threshold Properties window shown in Figure 5-17. To access this window, right-click on a status summary entry in the Component Status window and choose Properties from the context menu. The Status Message Threshold settings indicate that if one error status message is generated for SMS Site Component Manager, the status summarizer will change the component's status summary from OK to Warning. If five error status messages are generated, the component's status summary will change from Warning to Critical. Similarly, if 2000 informational status messages are generated for SMS Site Component Manager, the status summarizer will change the status summary of SMS Site Component Manager from OK to Warning, and if 5000 informational status messages are generated, the status summary will change from Warning to Critical.
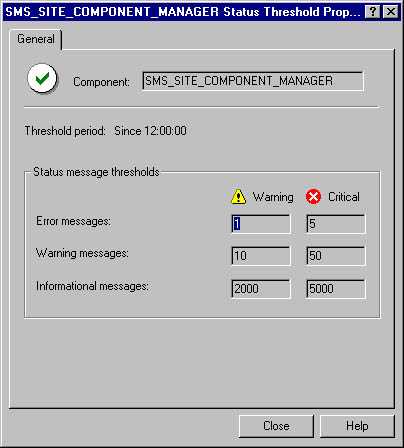
Figure 5-17. The Status Threshold Properties window.
Status thresholds for site system status are calculated similarly, but are based on available free space in the SMS site system and the site and software metering databases. Figure 5-18 shows the Free Space Thresholds Properties window, which you can access by right-clicking on the status summary entry in the Site System Status window and choosing Properties from the context menu. Notice that the free space thresholds change the storage object's status to Warning if free space falls below 20 MB and to Critical if free space falls below 10 MB.
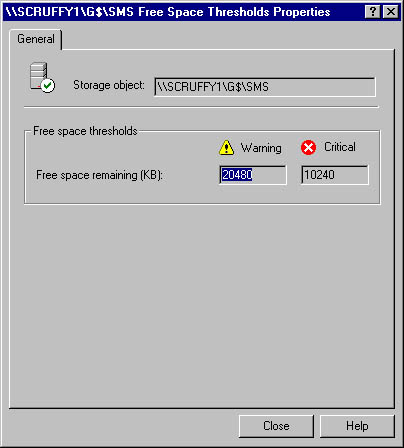
Figure 5-18. The Free Space Thresholds Properties window.
Other thresholds are specific to the databases based on a percentage of the database size. You'll learn how to modify these values or add new threshold values in the next section.
Configuring Status Summarizers
You can configure three status summarizer components: Component Status Summarizer, Site System Status Summarizer, and Advertisement Status Summarizer. To access these status summarizers, in the SMS Administrator Console expand the Site Settings folder and then expand the Status Summarizers folder. We'll look at the specific property settings for each of these status summarizers in the following sections.
Component Status Summarizer
To configure the Component Status Summarizer, follow these steps:
- Right-click on Component Status Summarizer in the Status Summarizers folder and choose Properties from the context menu to display the Component Status Summarizer Properties window, shown in Figure 5-19.
- Select the Thresholds tab to configure summary thresholds for each component, as shown in Figure 5-20.
- Select the message type you want to set the threshold for—informational, warning, or error—from the drop-down list and then double-click on the component whose thresholds you want to change to display the Status Threshold Properties window.
- Specify the number of warning and error messages that need to be generated (the threshold) before the Component Status Summarizer changes the status summary from OK to Warning or to Critical.
- Click OK to close the Status Threshold Properties window, and then click OK in the Component Status Summarizer Properties window to save your modifications.
Notice that the Enable Status Summarization and Replicate To Parent Site options on the General tab are selected by default. You can also specify the replication priority on this tab and the display interval, here called the threshold period.
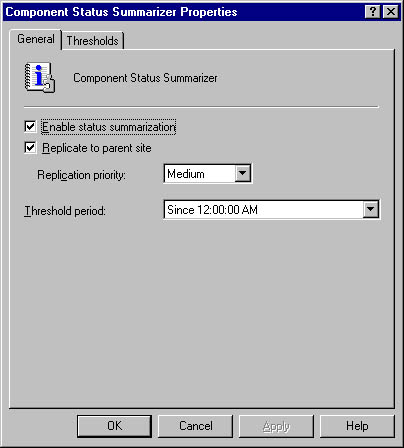
Figure 5-19. The General tab of the Component Status Summarizer Properties window.
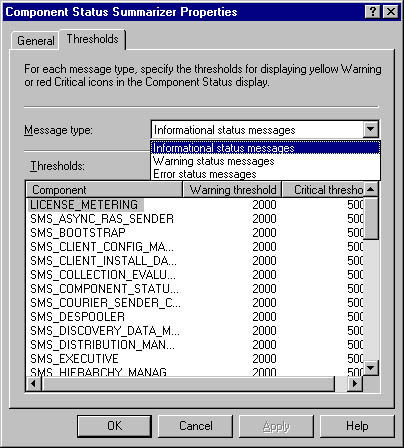
Figure 5-20. The Thresholds tab.
The default status message thresholds differ for each message type. Figure 5-21 shows the default settings for informational status messages.
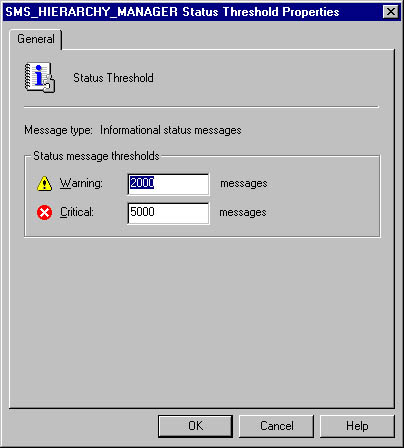
Figure 5-21. The default status message thresholds for informational status messages.
Figure 5-22 shows the default settings for warning status messages.
Figure 5-23 shows the default settings for error status messages.
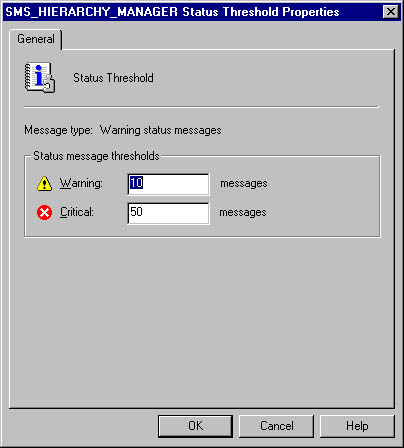
Figure 5-22. The default status message thresholds for warning status messages.
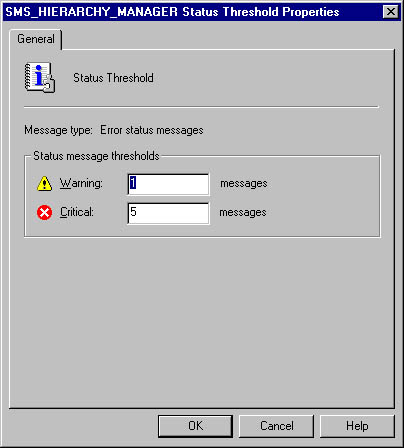
Figure 5-23. The default status message thresholds for error status messages.
Site System Status Summarizer
- To configure the Site System Status Summarizer, follow these steps: Right-click on Site System Status Summarizer in the Status Summarizers folder and choose Properties from the context menu to display the Site System Status Summarizer Properties window, shown in Figure 5-24.
- Select the Thresholds tab to configure space thresholds for each database and for each site system, as shown in Figure 5-25.
- To add a specific site server to monitor its status, click the New button (the yellow star) in the Specific Thresholds section to display the Free Space Threshold Properties window, shown in Figure 5-26.
- Click OK again to save your changes.
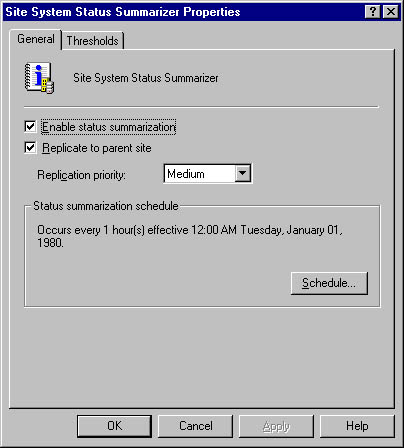
Figure 5-24. The General tab of the Site System Status Summarizer Properties window.
Notice that the Enable Status Summarization and Replicate To Parent Site options on the General tab are checked by default. The replication priority can also be set here. Click the Schedule button to display the Schedule dialog box, where you can specify a schedule for when and how often site system status summarization takes place.
SMS has already set general default values for site systems. You can modify these settings by entering new values in the Warning or Critical text boxes. SMS has also defined default space threshold values for the SMS database and the software metering database. If you need to change these values, double-click on the entry to display the Free Space Threshold Properties window, where you can specify the values you prefer.
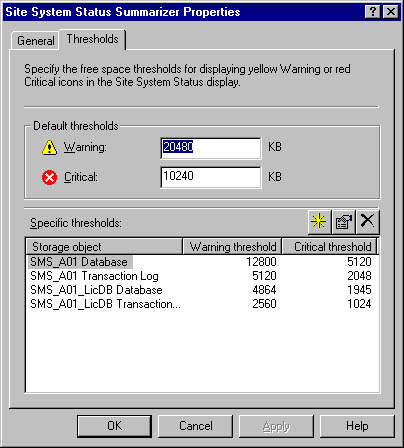
Figure 5-25. The Thresholds tab.
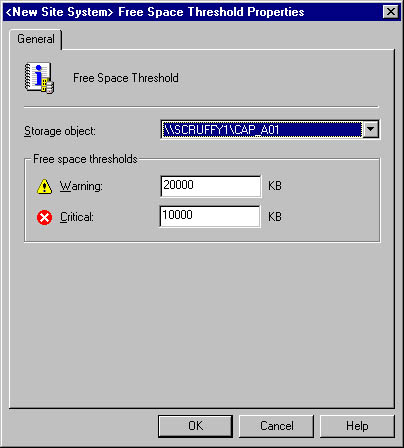
Figure 5-26. The New Site System Free Space Threshold Properties window.
Select the site system to monitor from the Storage Object drop-down list, enter the desired free space thresholds to monitor for in the Warning and Critical text boxes, and click OK.
Advertisement Status Summarizer
To configure the Advertisement Status Summarizer, follow these steps:
- Right-click on Advertisement Status Summarizer in the Status Summarizers folder, and choose Properties from the context menu to display the Advertisement Status Summarizer Properties window, shown in Figure 5-27.
- Choose OK to save your modifications.
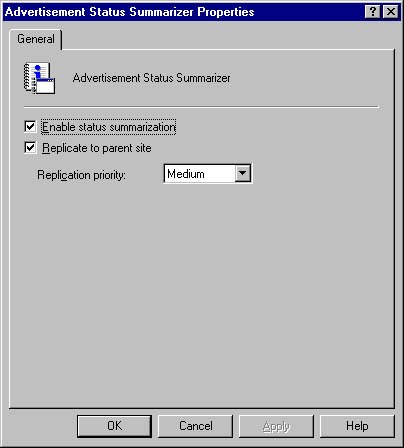
Figure 5-27. The General tab of the Advertisement Status Summarizer Properties window.
Notice that the Enable Status Summarization and Replicate to Parent Site options on the General tab are checked by default. You can also specify the replication priority on this tab.
Status summarizers help us define how component, system, and advertisement status are displayed to the SMS administrator based on their message type—<d>informational, warning, or error. In the next section, we'll look at further refining which status messages are captured and displayed in the Status Message Viewer.
EAN: 2147483647
Pages: 167