Working with Status Messages
Virtually every SMS 2.0 component and service generates status messages as it goes about its business. These messages are not the sometimes vague or unhelpful variety you may have come to dread in the Windows NT Event Viewer. On the contrary, SMS 2.0 status messages are rich with details. In the event of error messages, the details very often offer potential reasons for the error and suggest possible remedies.
Status messages represent the flow of process activity for each site system and client. They are automatically consolidated and filtered for display using status summarizers and status filters (discussed in detail in the sections "Understanding Status Summarizers" and "Filtering Status Messages" later in this chapter). As you'll see throughout this book, these status messages will provide your first and often best insight into how a process or task works and what to do in the case of a problem.
There are three levels of severity for status message in SMS 2.0: informational, warning, and error messages. Informational messages are just that—informational. They simply record the fact of an event occurring, such as a service or component starting, or the successful completion of a task, and so on. Warning messages are of concern, but they do not necessarily indicate problems that are fatal to the operation of the site server. They generally indicate potential problems, such as low disk space, a component that has failed or that is retrying a task, or a file that has been corrupted. Error messages are usually of great concern, as they indicate problems that could harm the SMS site. These require the attention of the SMS administrator for resolution. Error messages include authentication problems, the complete failure of a service or component to complete a task, database access problems, and so on.
Every status message that is generated will fall into one of three message type categories: milestone, detail, and audit. Milestone message types usually relate to the start or completion of a task. For example, a successful completion would generate a milestone info message, whereas an unsuccessful task would generate a milestone warning or error message. Detail message types generally refer to the steps in a process and make sense only in the context of the status message process flow. Again, these might be informational, warning, or error messages depending on the nature of the situation being reported. Audit message types refer to objects being added, deleted, or modified in some way, usually by the SMS administrator—for example, a site system role being assigned or a collection membership being modified.

TIP
Status messages sometimes stand alone and can be readily interpreted from the detail message. In many cases, however, a status message will make sense only in the context of a process flow. It is always a good idea, therefore, to look not only for a specific message reference, but also at the status messages preceding and following the reference to gain further insight into the specific message. Throughout this book, when we explore process flows, you should review the status messages for all the SMS components and services involved to develop a well-rounded understanding of the process.
Status messages can be viewed through the System Status folder in the SMS Administrator Console, as shown in Figure 5-1. From this folder, you can view the advertisement status, the package status, the component status, and the site system status for the SMS site, and you can execute status message queries. We'll discuss status messages for advertisements and packages as we get to those topics in Chapter 12.
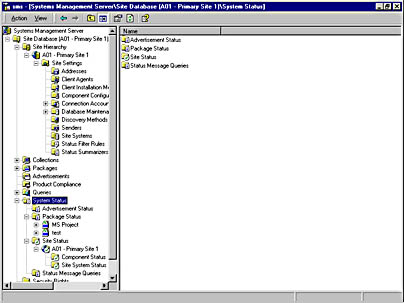
Figure 5-1. The expanded System Status folder in the SMS Administrator Console.
Viewing Site Status Messages
Site status messages fall into two categories: component status and site system status. If all is well with your site, you should see a green check mark (an OK indicator) to the left of each folder, as in Figure 5-1. If any problems have been detected, this check mark might change to an exclamation point in a yellow triangle (a Warning indicator) or a red "x" (a Critical indicator) based on the thresholds you set. (For a detailed discussion of thresholds, see the section "Status Message Thresholds" later in this chapter.) The icons for OK, Warning, or Critical indicators will help you determine which components need attention.
You will always begin troubleshooting by viewing the summary information. First click on Component Status in the Administrator Console to display a list of all SMS components and services and a summary of their current status, as shown in Figure 5-2. In the Component Status window, you can see at a glance the component status; the site system on which the component is running; the component name; its current state; the number of error, warning, and informational messages that have been generated; how the component wakes up; when a scheduled component next runs; the last time the component woke up; and the last time a message was written. In this case, all the SMS components are running properly.
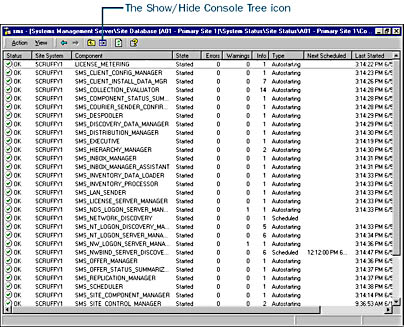
Figure 5-2. The Component Status window in the SMS Administrator Console.
TIP
Click on the Show/Hide Console Tree icon (third from the right on the toolbar at the top of the SMS Administrator Console) to hide the console tree so that you can more easily view the Component Status window.
Click on the Site System Status folder to display a list of all the site systems identified for the site and their summary status by site system role, as shown in Figure 5-3. In the Site System Status window, you can view the site system status, the site system name, the role that has been assigned to the site, the location of the storage object (partition and folder or database), total and free storage space, free space represented as a percentage of the total, and whether the system has been down. In this case, all site systems are running properly.
The detailed information behind each message summary entry in the Component Status window pertains specifically to that component. However, the detailed messages behind each summary entry in the Site System Status window reference messages from any number of SMS components and services that are running on or that affect that particular site system.
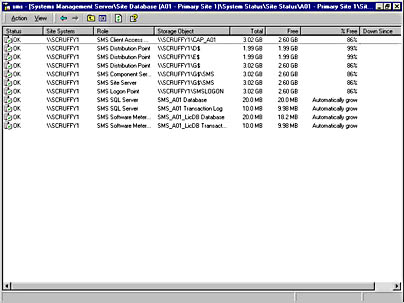
Figure 5-3. The Site System Status window.
We examined how to view status messages in Chapter 3; let's review here. To view the detailed information about the selected message for a specific component in the Component Status window, follow these steps:
- Right-click on the component's summary entry, and choose Show Messages from the context menu to display a list of message types, as shown in Figure 5-4.
- The All option displays all messages collected for this entry, Errors displays only error messages, Warnings displays only warning messages, and Info displays only informational messages. For this example, choose Info. The SMS Status Message Viewer will appear, as shown in Figure 5-5.
- To view a detailed description of the message, position the mouse pointer over the Description field to display a pop-up window, shown in Figure 5-6.
- Close the Status Message Viewer when you have finished reviewing the message details.
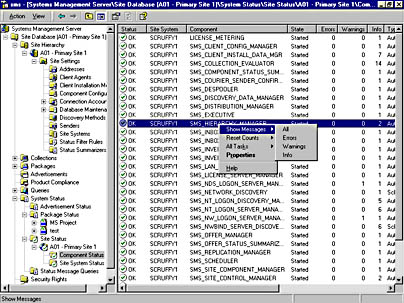
Figure 5-4. Displaying a list of message type options.
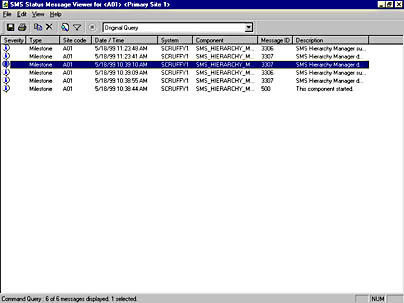
Figure 5-5. The Status Message Viewer.
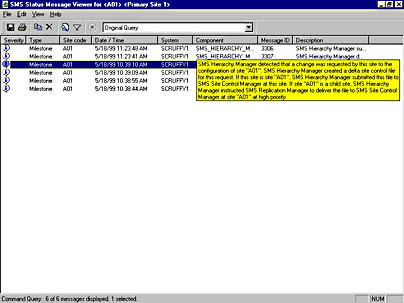
Figure 5-6. A pop-up window containing a detailed description of a status message.
Alternatively, you can double-click on the message to display the Status Message Details dialog box, shown in Figure 5-7. This dialog box provides you with more specific details about the message. It also contains buttons that enable you to view the previous and following messages. Click OK to close the dialog box.
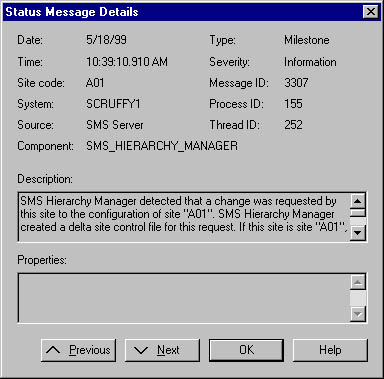
Figure 5-7. The Status Message Details dialog box.
To view the detailed information about the selected message for a site system in the Site System Status window, follow these steps:
- Right-click on the site system's summary entry and choose Show Messages from the context menu to display a list of message types.
- Choose All to display all messages collected for this entry, choose Errors to display only error messages, choose Warnings to display only warning messages, or choose Info to display only informational messages.
- After you choose an option, the Set Viewing Period dialog box is displayed, as shown in Figure 5-8.
- Click OK to display the Status Message Viewer, shown in Figure 5-9. You can also click Skip if you prefer not to limit the scope of the messages displayed.
- View the detailed description for each message either by positioning your mouse pointer on the message's Description field to display a pop-up window or by double-clicking on the message to display the Status Message Details dialog box.
- Close the Status Message Viewer when you have finished reviewing the message details.
- Now that you know how to view status messages, let's look at how to configure the Status Message Viewer.
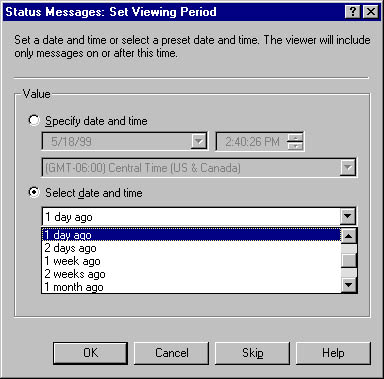
Figure 5-8. The Set Viewing Period dialog box.
Select the Specify Date And Time option to display only messages generated after the date and time you enter. Select the Select Date And Time option to display messages generated within a more generic time period, from 1 hour ago to 1 year ago.
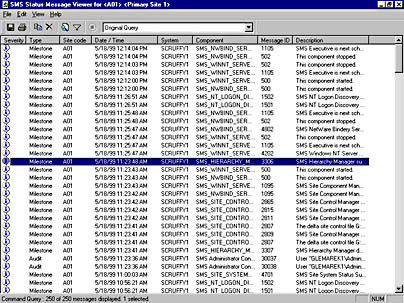
Figure 5-9. The Status Message Viewer displaying the detailed messages for a Site System Status summary entry.
Setting Status Message Viewer Options
When status messages are generated by SMS components or services, they are written to the site database. The Status Message Viewer uses the SMS Provider to query the database for the detailed messages when you use the technique described in the preceding section.
As shown in Figure 5-9, the Status Message Viewer for the site system status displays all the SMS components that are running on that site system or that affect it in any way. These messages are the same as those displayed for each component in the Component Status window. For example, the selected Hierarchy Manager message in Figure 5-9 is the same as the first message listed in Figure 5-5.
Regardless of whether you are viewing component status or site system status, the Status Message Viewer always displays the following information:
- Severity Specifies whether the message category is informational, warning, or error
- Type Specifies whether the message type is milestone, detail, or audit
- Site Code Specifies the three-character site code of the site for which the message was generated
- Date/Time Specifies the time and date stamp indicating when the message was generated
- System Specifies the server name of the site system for which the message was generated
- Component Specifies the name of the SMS component or service that generated the message
- Message ID Specifies the numeric code related to the task performed by the SMS component or service that generated the message
- Description Provides a detailed description of the message
The Status Message Viewer provides many features that can facilitate your analysis of messages. Let's begin with some of the GUI features. You can change the sort order of each column simply by clicking on the column header. Each column has three sort options: click once to sort from lowest to highest, click again to sort from highest to lowest, and click once again to return to the default column order. The columns can, of course, be resized by clicking on the border between each column heading and dragging to make the column wider or narrower. You can also move the columns to customize the display simply by dragging and dropping a column header to a new position.
By right-clicking on any message entry to display its context menu, you can copy it, delete it, or display its Status Message Details window. You can also set a filter for the Status Message Viewer or refresh all the messages from this menu. Multiple messages can be selected for copying, deleting, and printing by using the old Windows Explorer Ctrl-click method.
The Status Message Viewer also provides a variety of options and features that are enabled through the menus on its menu bar. Because most of these settings are self-evident, here we'll look only at those that are unique or of special interest to the SMS administrator—in particular, the options in the Status Viewer Options window and the Filter Status Messages window.
The Status Viewer Options Window
Let's start by looking at the Status Viewer Options window. Choose Options from the View menu to display the Status Viewer Options window, shown in Figure 5-10.
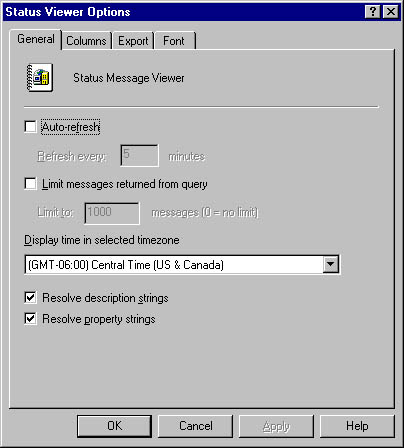
Figure 5-10. The Status Viewer Options window.
The General Tab The Status Message Viewer does not refresh the interface with new messages by default unless you tell it to—for example, by pressing F5. The General tab, shown in Figure 5-10, lets you enable auto-refresh and specify a refresh interval. However, having the viewer automatically refresh itself will incur additional resource cost, so you shouldn't select this option unless you intend to leave the viewer open for a long period of time—perhaps to follow the flow of a task or the generation of messages. You can also limit the number of messages that are collected and displayed.

CAUTION
The Status Message Viewer might leak virtual memory if you keep it open for long periods of time. Don't forget to close the viewer when you aren't using it.
The Status Message Viewer displays messages stamped with the local time and date. The General tab lets you specify different time zones if you want to see when a message was generated on a site or site system in a different geographic location.
Most status messages are generated based on generic text strings in which variables have been inserted to customize the data to a specific component, time, and so on. For example, message ID 4611 for SMS Component Status Summarizer contains the text:
SMS Component Status Summarizer reset the status of component %1, running on computer %2, to OK. |
This message always reads the same, except that the percent values are replaced with a specific SMS component value and server value. Displayed in the Status Message Viewer for SMS Site Component Manager on site server Scruffy1, this message would read:
SMS Component Status Summarizer reset the status of component "SMS Site Component Manager", running on computer "Scruffy1", to OK. |
If you clear the Resolve Description Strings and Resolve Property Strings check boxes on the General tab, the status messages would resolve more quickly but would leave empty quotation marks in the variable positions, rendering the messages not especially helpful to the SMS administrator.
The Columns Tab The Columns tab of the Status Viewer Options window, shown in Figure 5-11, enables you to customize the information displayed in the Status Message Viewer by adding columns to view thread and process IDs or by removing columns that may not be of interest.
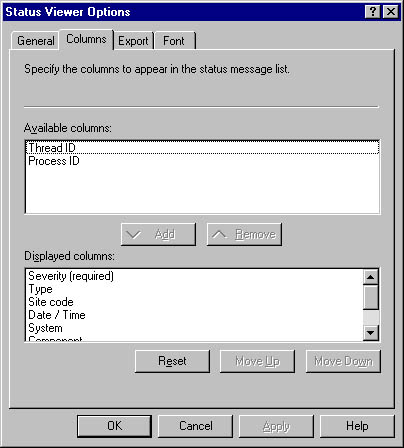
Figure 5-11. The Columns tab of the Status Viewer Options window.
The Export Tab By default, status messages are deleted after seven days, but you can adjust this setting to suit your needs. Because some components can generate a multitude of messages, you may decide to delete messages more frequently to better manage database space. If you need to save or copy status messages to a file for future reference and analysis or to print them out, the Export tab of the Status Viewer Options window, shown in Figure 5-12, provides options for doing so.
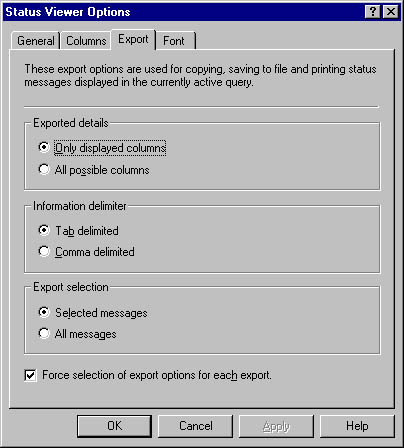
Figure 5-12. The Export tab of the Status Viewer Options window.
The Exported Details section lets you specify whether to include all possible data about a status message or only the data associated with the displayed columns. Under Information Delimiter, you can identify whether columns should be exported as tab delimited or comma delimited. This option is helpful if you expect to import this data into some other reporting or analysis tool such as Microsoft Excel or Microsoft Access. The Export Selection section lets you specify whether to export only messages that you have highlighted in the viewer or all messages. By default, every time you choose to copy, print, or save a message, the Export tab will be displayed, allowing you to modify the options before continuing. If you want the same options to apply to every copy, print, or save operation, clear the Force Selection Of Export Options For Each Export check box.
The Font Tab The Font tab, shown in Figure 5-13, enables you to set the typeface, style, and size of the font that will be used to display messages in the Status Message Viewer. Be careful to choose something readable. A decorative font may look pretty at first, but if you'll be scrutinizing messages for long periods of time, a poorly chosen font can give you a headache.
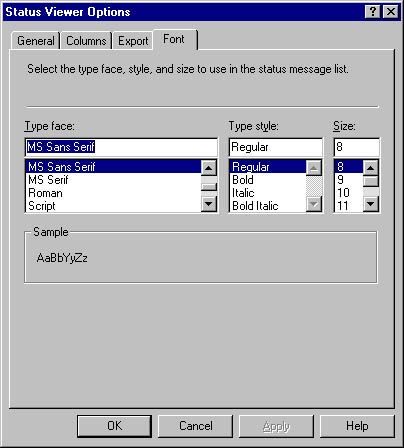
Figure 5-13. The Font tab of the Status Viewer Options window.
Filter Options
Another neat feature of the Status Message Viewer is the set of filter options, which let you customize which messages are displayed in the Status Message Viewer. If you've used the filter options in Windows NT Event Viewer, these filter options will be familiar. To set the filter options, choose Filter from the View menu to display the Filter Status Messages window, shown in Figure 5-14.
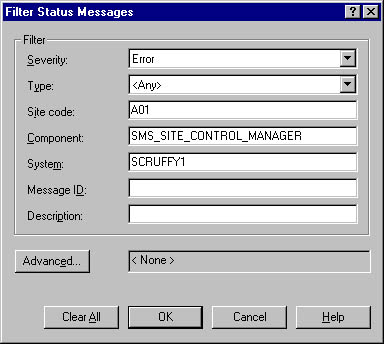
Figure 5-14. The Filter Status Messages window.
You can filter messages based on the specified criteria. Figure 5-14 shows a filter that displays error messages of any type (milestone, detail, and audit) for site A01 that have been generated by SMS Site Control Manager on site system Scruffy1. Click the Advanced button to display the Advanced Options dialog box, where you can also specify filtering based on thread ID and process ID, message properties, and a range of time.
![]()
REAL WORLD Using Queries to Customize the Status Message ViewerThe status messages that are displayed for a particular component, site system, package, advertisement, and so on are built based on an SMS query for that status message object. By default, the original query is listed in the drop-down list on the Status Message Viewer toolbar. To view the original query's criteria, choose Query Information from the View menu to display the Query Information dialog box, shown in Figure 5-15.
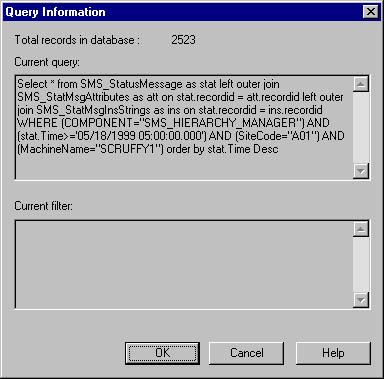
Figure 5-15. The Query Information dialog box.
The original query usually shows all messages for a specific component on a specific site system. However, there are many predefined queries that you can run against any status message object; we'll look at some of these predefined queries later in this section.
You can display and compile the status messages based on a query by selecting the query you want from the drop-down list of queries on the Status Message Viewer toolbar. For example, Site Component Manager status messages may include messages generated on several site systems in your site as well as on child sites. Perhaps you need to see only the status messages for your site or for a specific site system. Status message queries are available for both of these situations: All Status Messages From A Specific Component At A Specific Site and All Status Messages From A Specific Component On A Specific System. To resolve these queries, select a query from the drop-down query list to display its corresponding query resolving window, enter the requested values, and then click OK to execute the query. The Status Message Viewer screen will be refreshed accordingly.
EAN: 2147483647
Pages: 167