|  An organization chart shows the relationship between individuals in an organization. For example, you can show the relationship between a manager and employees within a company. When you create an organization chart, a sample chart appears. You can add text and format the chart boxes and connecting lines. Once you insert an organization chart, you can click the chart to edit it at any time. When you're finished working with the organization chart, you simply deselect the object. To convert an existing organization chart from a previous version of PowerPoint, simply double-click the chart, and PowerPoint converts it. Create an Organization Chart -
 | Create an organization chart in one of the following ways: | -
On an existing slide, click the Insert menu, point to Picture, and then click Organization Chart. -
Click the New Slide button on the Formatting toolbar, click a content layout in the Slide Layout task pane, click the Insert Diagram Or Organization Chart placeholder, select Organization Chart in the Diagram Gallery dialog box, and then click OK. -
 | Use the Organization Chart toolbar to design your organization chart. | -
 | If necessary, click a chart box in which you want to enter text. | -
 | Type a person's name , and then press Enter. | -
 | Type a person's title. | -
 | When you're done, click outside the chart box. | -
 | Click outside of the organization chart to deselect it. | 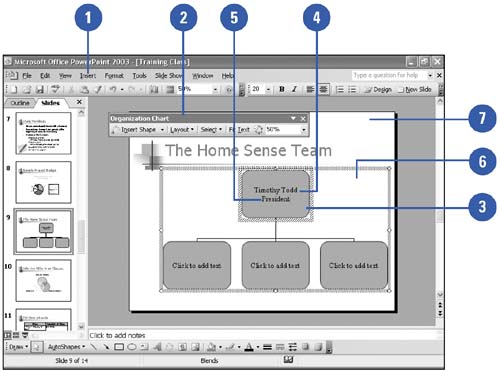 Select and Deselect Chart Boxes | To | Do this | | Select a single chart box | Click a chart box using the arrow pointer | | Select a set of chart boxes | Click the Select list arrow on the Organization Chart toolbar, and then click the set you want | | Select one or more levels of chart boxes | Click a chart box in the level you want to select, click the Organization Chart tool bar, click Level | | Deselect a chart box | Click outside the chart box | |  |