Enhancing a Data Series

graphics/microsoft37.gif

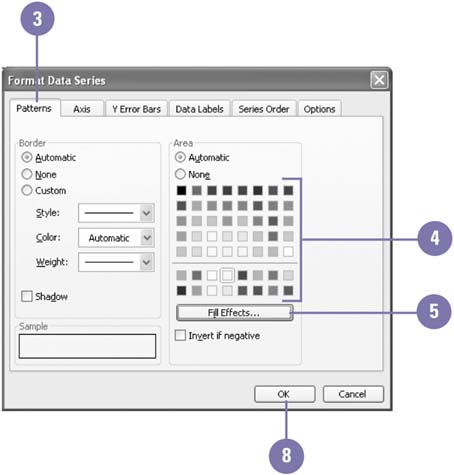
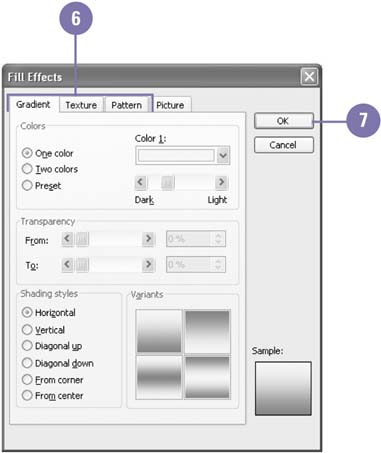
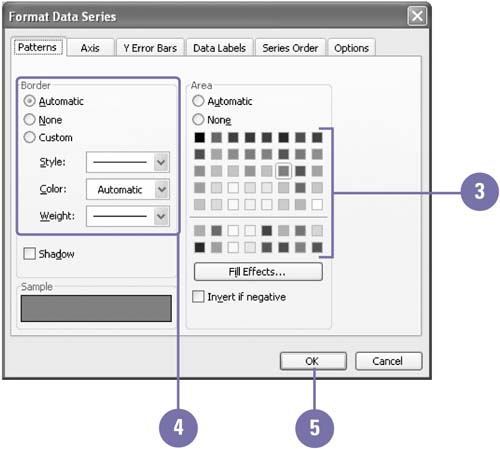
When you initially use the Chart Wizard, Excel automatically selects the colors that it will use to represent each data series. You can change one or all of the default colors. You may want more dynamic colors ”adding patterns and texture to further enhance a data series. Or, perhaps you'll be printing your charts in black and white and you want to ensure the readability of each data series. You can also insert a picture in a chart so that its image occupies a bar or column.

Change a Data Series Color or Pattern

graphics/one_icon.jpg

Click any data point in a data series to select it.

graphics/tow_icon.jpg

Double-click a data point in the selected data series.

graphics/three_icon.jpg

Click the Patterns tab.

graphics/foure_icon.jpg

Click a color in the Area palette. The selected color displays in the Sample box.

graphics/five_icon.jpg

If you want to add effects, such as textures, patterns, gradients, or pictures, click the Fill Effects button.

graphics/six_icon.jpg

Click the Gradient, Texture, or Pattern tab to change the qualities of the data series color.

graphics/seven_icon.jpg

When you're done, click OK.

graphics/eight_icon.jpg

Click OK if you're satisfied with the results shown in the Sample box, or select different options.

graphics/09inf22.jpg

graphics/09inf23.jpg

Did You Know?

You can format a chart object quickly . Double-clicking an object opens a corresponding Format dialog box, which you can use to change the object's attributes. Depending on which objects are selected, your formatting options will vary.

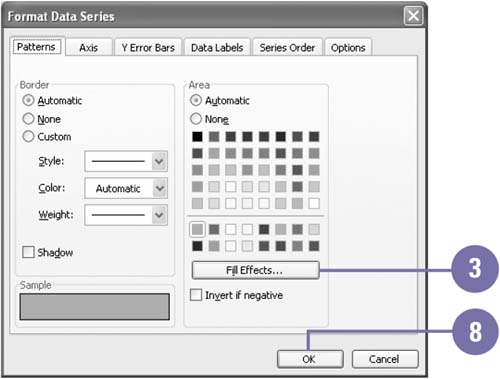
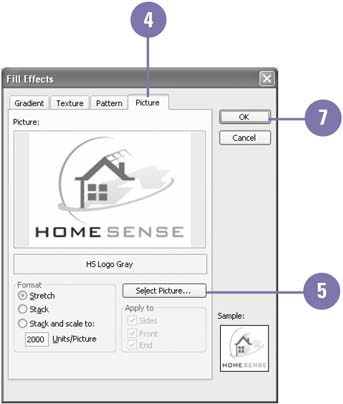
Add a Picture to a Data Series

graphics/one_icon.jpg

Select a data series.

graphics/tow_icon.jpg

Double-click a data point in the selected series.

graphics/three_icon.jpg

Click Fill Effects.

graphics/foure_icon.jpg

Click the Picture tab.

graphics/five_icon.jpg

Click Select Picture.

graphics/six_icon.jpg

Locate and select the graphics file.

graphics/seven_icon.jpg Click OK.

If you want the data point to contain one copy of the image stretched to fill it, click the Stretch option; or if you want the data point to contain many copies of the image, click the Stack option.

graphics/eight_icon.jpg

Click OK.

graphics/09inf24.jpg

graphics/09inf25.jpg

Delete a Picture from a Data Series

graphics/one_icon.jpg

Select a data series.

graphics/tow_icon.jpg

Double-click a data point in the selected series.

graphics/three_icon.jpg

Select a Color Area.

graphics/foure_icon.jpg

Select a Border.

graphics/five_icon.jpg

Click OK.

graphics/09inf26.jpg


Show Me Microsoft Office Excel 2003
ISBN: 0789730057
EAN: 2147483647
Year: 2002
Pages: 291

flylib.com © 2008-2017.
If you may any questions please contact us: flylib@qtcs.net