Analyzing Data in Excel
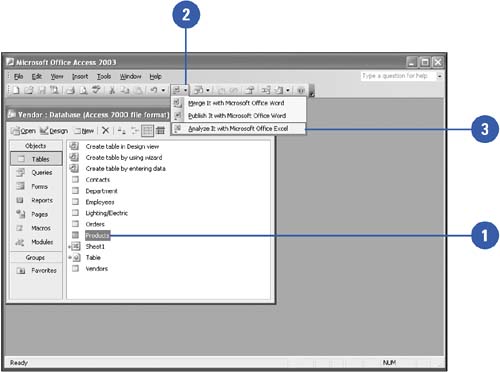
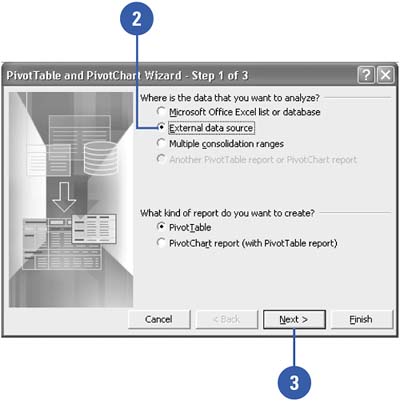
| Before you can analyze Access data in a workbook, you must convert it to an Excel file. You can either use the Analyze It With MS Excel command in Access to export data as an Excel table file or use the PivotTable And PivotChart Report wizard in Excel to use the Access data as a PivotTable , a table you can use to perform calculations with or rearrange large amounts of data. Once you determine what fields and criteria you want to use to summarize the data and how you want the resulting table to look, the wizard does the rest. You can also copy and paste or drag Access database objects (tables, queries, and so on) from the Database window to an Excel worksheet. Export an Access Table into an Excel Workbook
Create an Excel PivotTable from an Access Database
|
EAN: 2147483647
Pages: 318
- Structures, Processes and Relational Mechanisms for IT Governance
- Linking the IT Balanced Scorecard to the Business Objectives at a Major Canadian Financial Group
- Technical Issues Related to IT Governance Tactics: Product Metrics, Measurements and Process Control
- Governance in IT Outsourcing Partnerships
- Governance Structures for IT in the Health Care Industry